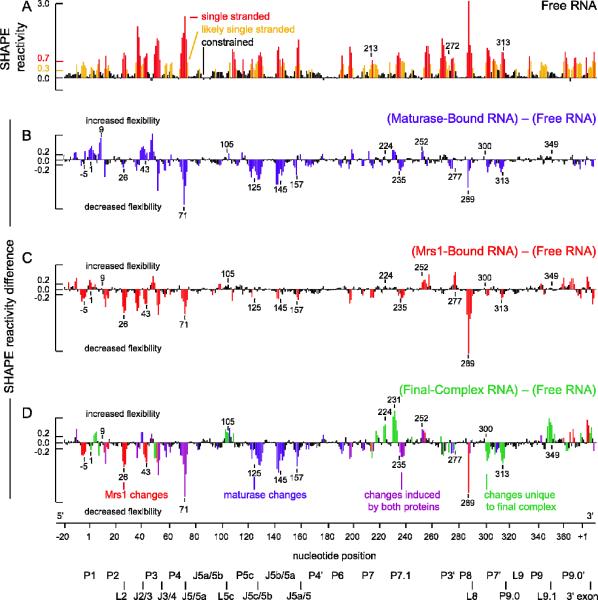
Figure 2.
Protein-assisted folding of the bI3 RNA monitored by SHAPE. (A) Reactivity as a function of nucleotide position for the free RNA. Bars are colored by reactivity. Difference plot histograms for RNA bound to (B) maturase, (C) Mrs1, and (D) both maturase and Mrs1. Nucleotides with absolute changes in reactivity greater than 0.2 (two-fold above background) are colored by the protein that induces a given effect: blue for maturase, red for Mrs1, purple if affected by both proteins and green for unique changes seen only in the holocomplex. Structural landmarks are highlighted below the axis.

