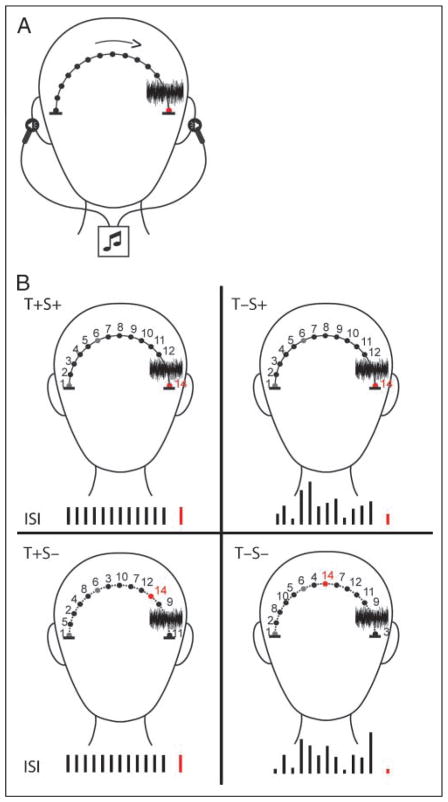
Figure 1.
Schematic of stimulus paradigm. (A) Experimental set-up. Tones were presented by insert earphones, using interaural time difference (ITD) cues to simulate perception of a moving stimulus from the left-to-right (or right-to-left) side of the head. Blackened circles depict the perceived tone locations. A white noise stimulus (noise spectrogram) occurred prior to the final tone (indicated by the red circle). The final tone was either a target or nontarget stimulus. (B) Four conditions of expectation are depicted. Numbers illustrate the position and order of the tones across the head. Black bars denote the length of the ISI. The red bar denotes the final tone of the trial (go/no-go). Temporal expectations (T+) were created by holding the timing of the stimulus constant. Spatial expectations (S+) were created by presenting the tones in a spatially constant motion along the trajectory (solid line). The absence of expectation was created by presenting tones with a random ISI along the trajectory (T−), random spatial distribution along the trajectory (S−), or both (T−S−). The first and sixth positions (gray circles) and position of the noise stimulus were fixed so that direction of motion could still be perceived even with irregular movement in time and space (dashed line).

