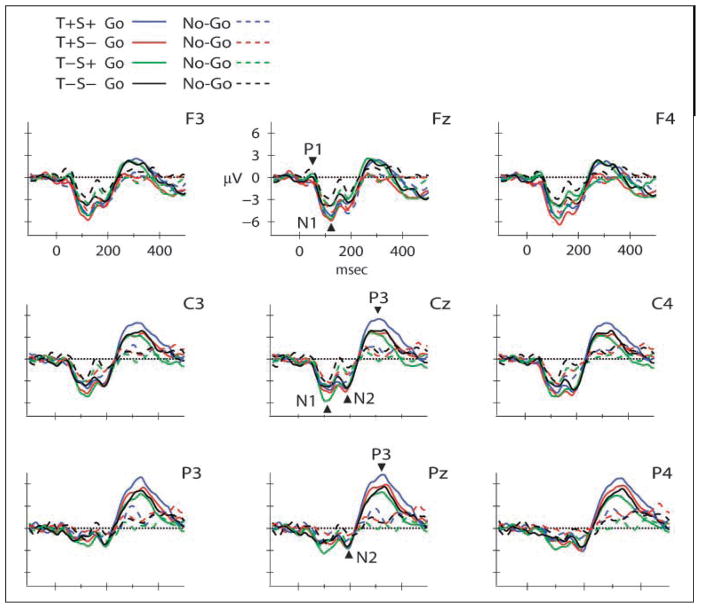
Figure 2.
Response requirements effects. Grand-mean waveforms are displayed at the midline (Fz, Cz, Pz), and lateral, frontal (F3, F4), central (C3, C4), and parietal (P3, P4) electrodes by condition (T+S+, blue; T+S−, red; T−S+, green; and T−S−, black), separated by response requirements (go solid lines/no-go dashed lines). Positive polarity is upward. N1, N2, and P3 are labeled at the midline, with arrows pointing toward the peak of the component. Effects of the go response are reflected in N1, N2, and P3 components.

