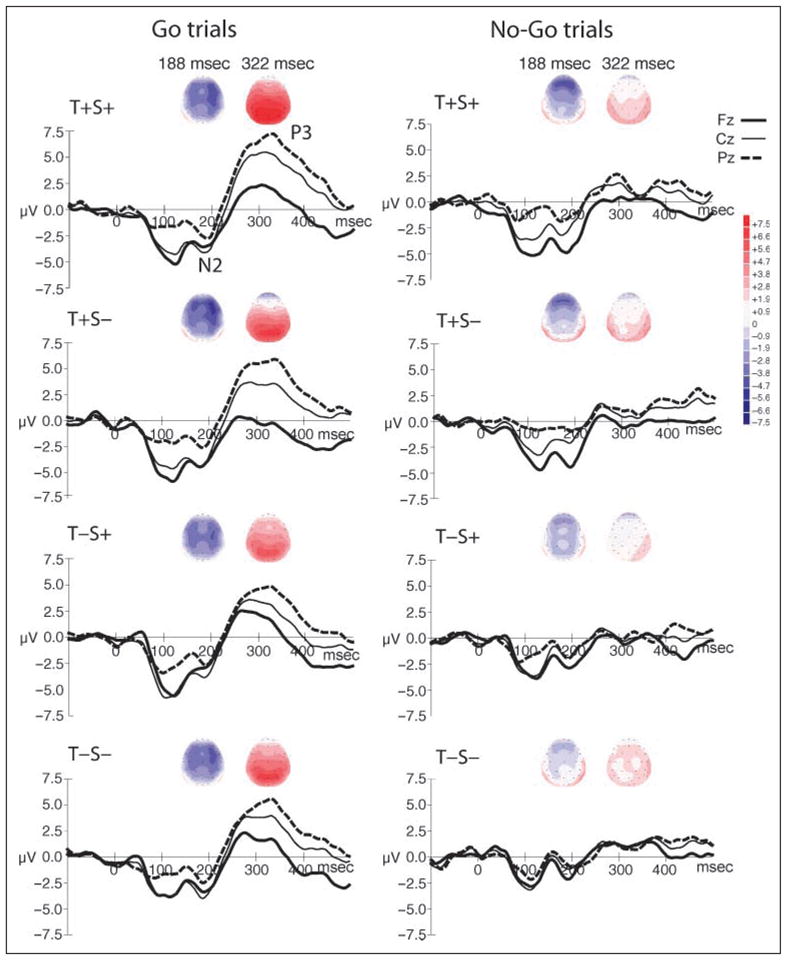
Figure 4.

Spline-interpolated isovoltage maps of the grand-mean waveforms are shown separately for go and no-go trials, centered on the peak latency of the N2 and P3 components (188 and 322 msec, respectively) in each condition (T+S+, T+S−, T−S+, T−S−). Corresponding ERP graphs are displayed below the voltage maps, showing ERP waveforms from Fz (thick black solid line), Cz (thin black solid line), and Pz (thick black dashed line) electrodes. The y-axis shows the amplitude of the waveforms (+7.5 to −7.5 μV), which corresponds to the scale for the voltage maps in intensity of color (darker color for higher amplitude; red is positive polarity and blue is negative polarity). The N2 and P3 components are labeled in the top, left graph. The stronger frontal scalp distribution of N2 evoked when temporal expectation could be formed (T+S+, T+S−), which is observed in both go and no-go trials (left and right columns, blue color). The P3 component is clearly tied to response requirements, being elicited only in the go trials, with a strong focus at parietal electrodes (left column, red color).
