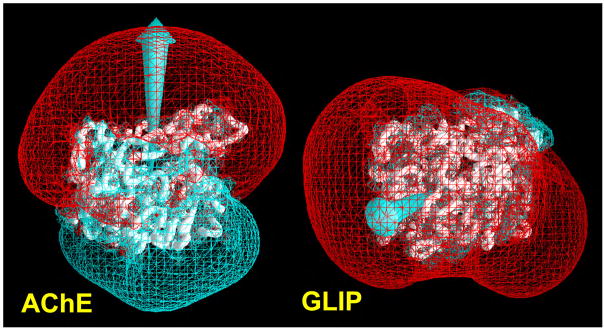
Figure 9.
Backbone drawings of TcAChE (left) and GLIP (right) with electrostatic potentials superimposed. Backbones of the proteins are displayed as white “worms”. The isopotential surfaces were generated using the program GRASP [79]. The red surface corresponds to the isopotential contour, −1kT/e, and the blue one to the isopotential contour, +1kT/e, where k is the Boltzmann constant, T is the temperature, and e is the electronic charge. Arrows indicate the direction of the dipole in each protein (taken from Ref. [75]).

