
Figure 4.
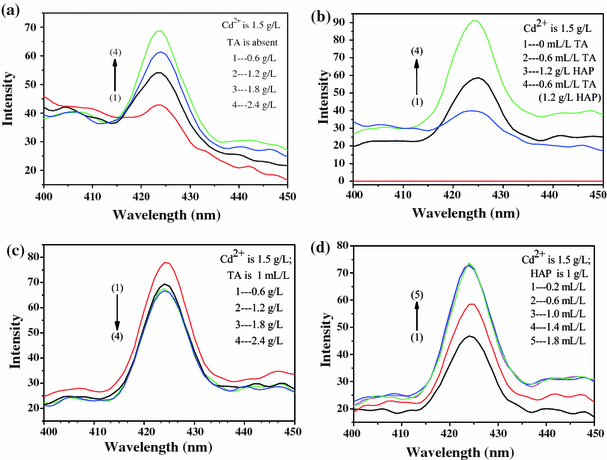
a PL spectra under different concentration of HAP; b PL spectrum under different conditions; c PL spectra under different concentrations of HAP; d PL spectra under different concentrations of TA
Official websites use .gov
A
.gov website belongs to an official
government organization in the United States.
Secure .gov websites use HTTPS
A lock (
) or https:// means you've safely
connected to the .gov website. Share sensitive
information only on official, secure websites.
a PL spectra under different concentration of HAP; b PL spectrum under different conditions; c PL spectra under different concentrations of HAP; d PL spectra under different concentrations of TA