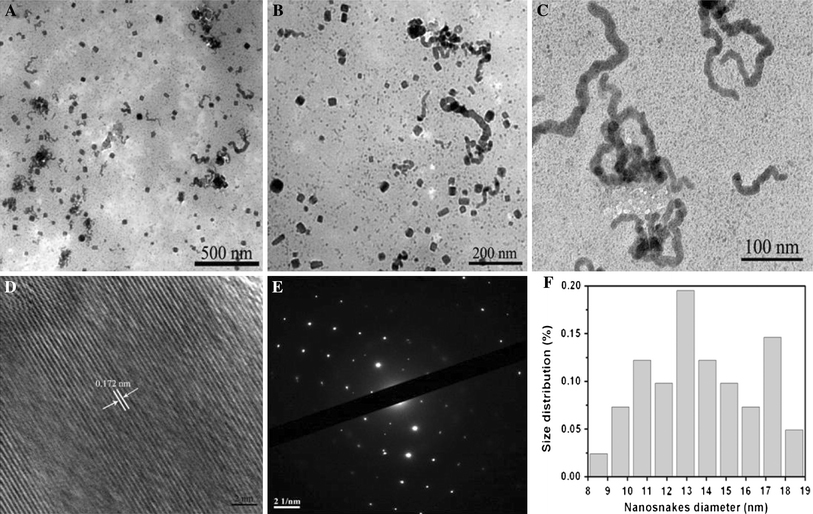
Figure 3.

TEM images of BSA–CuSe nanosnakes obtained after different aging time in the typical experiment: a 24 h, b 48 h, and c 96 h, respectively. d HRTEM image of an individual nanosnake. e SAED pattern in an area including many nanosnakes. f The histogram of nanosnakes at 96 h
