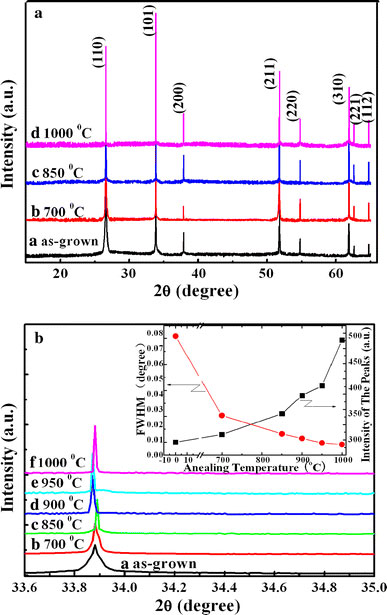
Figure 1.

aXRD patterns ofaas-grown and post-annealed SnO2nanowires atb700 °C,c850 °C, andd1,000 °C, respectively.bThe (101) diffraction peak ofaas-grown and post-annealed atb700 °C,c850 °C,d900 °C,e950 °C andfannealed at 1,000 °C, respectively, inset is the variation of the FWHM and the intensity of the peaks as a function of annealing temperature
