

Abstract
BACKGROUND
Fenugreek is a legume plant used as an ingredient of curry spice. Incidents of IgE-mediated food allergy to fenugreek have been reported. Coincidence with allergy to peanut, a major food allergen, seems to be common suggesting a rather high rate of cross-reactivity.
OBJECTIVE
Characterization of fenugreek allergens using patient sera and mass spectrometry-based proteomic analysis.
METHODS
Allergenic fenugreek proteins were detected by immunoblotting, using sera from 13 patients with specific IgE to peanut and fenugreek. IgE-binding proteins were analyzed by peptide mass fingerprinting and peptide sequencing.
RESULTS
A fenugreek protein quintet in the range from 50 kDa to 66 kDa showed high IgE-affinity, the protein at 50 kDa reaching the strongest signals in all patients. Proteomic analyses allowed the classification of several fenugreek proteins to a number of allergen families. Fenugreek 7S-vicilin and 11S-legumin were partly sequenced and revealed considerable homologies to peanut Ara h 1 and Ara h 3, respectively. The presence of a fenugreek 2S albumin and pathogenesis-related (PR-10) plant pollen protein was assumed by database searching results.
CONCLUSION
In this study, individual fenugreek proteins were characterised for the first time. Observed homologies to major peanut allergens provide a molecular explanation for clinical cross-reactivity.
Keywords: allergen, allergenicity, fenugreek, mass spectrometry, peanut, proteomics
Introduction
Fenugreek (Trigonella foenum-graecum) is a legume plant with maple-like flavour traditionally used as spice in Indian-style meals. It is also added as an aromatic condiment to different kinds of manufactured foods. Fenugreek is generally considered safe for human consumption [1]. Recently, however, several cases of fenugreek-induced allergy have been described, following oral or occupational exposure to milled fenugreek seeds [2, 3].
The large legume family (Fabaceae) comprises 730 genera with over 19,400 species, including important agricultural crops like peanuts, beans, peas, soy, lentils, chickpeas and lupins. An increasing number of legume proteins have been found to be allergenic, but the prevalence of food allergies to the different legume plants varies geographically and seems to depend on dietary habits [4 – 6]. Peanut, soy and lupin are among the major food allergens with relevance for the public health. Labelling is required for their utilization in manufactured food products [7].
The rising prevalence [8] and seriousness of peanut allergy [9] has led to a corresponding increase in studies evaluating the allergenic potentials of the individual peanut proteins, including members of four dominant plant allergen families [10, 11]. Peanut profilin (Ara h 5), pathogenesis-related (PR-10) pollen protein (Ara h 8), prolamins (Ara h 2, Ara h 6, Ara h 7, Ara h 9), cupins (Ara h 1, Ara h 3, Ara h 4) and oleosins (Ara h 10, Ara h 11) have been molecularly characterised and immunochemically studied [12 –15].
Allergy to fenugreek evolves mainly from primary peanut allergy. This is due to considerable cross-reactivity between the two legumes although primary sensitization to fenugreek has also been shown [16]. Cross-reactivity is caused by homologous proteins containing conserved sequence motifs, which are IgE-binding epitopes [17].
Recently, a relatively high number of cases that may involve peanut-fenugreek cross-reactivity have been reported to the Norwegian National Register and Reporting System for Severe Allergic Reactions to Food [18]. The allergenicity of fenugreek seed proteins was studied by immunoblot using patient sera. Major IgE-binding fenugreek proteins were detected in a range from 12 to 74 kDa, indicating that the major peanut allergens Ara h 1, Ara h 2, and Ara h 3 are strong candidates for causing the observed cross-allergenicity [19].
The present study will be an endeavour to further identify and characterize potential fenugreek allergens with mass spectrometry-based proteomic analysis [20, 21]. The designation of the fenugreek proteins to specific protein families might be possible through the alignment of the fenugreek proteins to known major legume allergens, which would serve as a possible explanation for the observed cross-reactivities.
Methods
Patients
Sera were obtained from thirteen patients, registered by the NorFoodAllergyReg with specific IgE (immunoglobulin E) against fenugreek and peanut [16]. Registration in NorFoodAllergyReg is voluntary, and written informed consent is given. Clinical information is given in a form submitted by the reporting physician, most often together with a blood sample and in some cases a food sample. Serum is stored in conformity with Norwegian law in a registered diagnostic bio-bank. Serum IgE specific for fenugreek (Rf305) and peanut (f13) were determined using ImmunoCap™ (Phadia, Uppsala, Sweden).
Fenugreek protein
Fenugreek powder (Trigonella foenum-graecum semen 0.7 mm, Norsk Medisinal depot ASA, Oslo, Norway) was extracted by the method described earlier [16] and 2 mg/ml aliquots were stored at −20°C.
Gel electrophoresis and Immunoblot
The NuPAGE Gel System (Invitrogen, Carlsbad, CA) was used for electrophoretic separation of proteins in accordance with the manufacturer’s instructions as previously described [16]. Samples contained 3 μg or 16 μg fenugreek proteins for the immunoblotting or mass spectrometry experiments, respectively. Proteins were either stained with SimplyBlue™ Safe Stain (Invitrogen) and used for in-gel digestion and MS experiments, or transferred electrophoretically onto nitrocellulose membrane (Bio-Rad) in an XCell II Blot Module (Invitrogen).
Immunoblots were treated and developed as previously described[16], using 1:20 diluted patient sera and incubating subsequently with two antibodies (anti-human IgE 1:1000; Dako, Glostrup, Denmark and HRP-conjugated goat anti-rabbit antibody 1:5000; Zymed, San Francisco, CA) for signal enhancement.
GelPro Analyzer® Image Analysis
Immunoblots were scanned and processed using GelPro Analyzer® Image Analysis (MediaCybernetics, Bethesda, MD). IgE-binding signal intensities were determined by applying Standard Optical Density Fitting correlating (2nd order polynomial) the number of pixels measured and the optical density (OD). The measured relative maximum OD values were normalised using the 38 kDa-band in the protein reference standard on each blot. The signal intensities of 17 protein bands were summarized, including data from all patients.
Sample preparation for MS experiments
Protein bands of interest were excised from the SDS-Page gels and the gel slices were placed in microfuge tubes, sliced into pieces and destained by shaking with acetonitrile (ACN)/50 mM NH4HCO3 (50/50) at room temperature (RT) for 10 min. The liquid was discarded, and the procedure was repeated twice. In the instance of persistent blue colour, the gel was treated with 100 mM NH4HCO3 at 50°C for 10 min. After drying in a Speed-Vac centrifuge (Heto, Allerød, Denmark) for about 10 min, proteins in the gel were reduced with 1.5 mg/ml dithiothreitol (Sigma Chemicals, St. Louis, MD) in 25 mM NH4HCO3 at 56°C for 1 h in a heating block (Dri-Block, Techne, Duxford, UK). The incubation mixture was cooled to RT and supernatant was discarded following centrifugation at 13000g for 2 min (Eppendorf GmbH, Hamburg, Germany).
Proteins were alkylated by incubation with 10 mg/ml iodoacetamide (Sigma Chemicals) in 25 mM NH4HCO3 at RT for 45 min in the dark under shaking (Shuttler MTS 4I, IKA-Werke GmbH, Staufen, Germany). The supernatant was discarded and the gel pieces were washed once with 100 mM NH4HCO3 and twice with ACN/50 mM NH4HCO3 (50/50), each time for 10 min at RT under shaking. Gel pieces were dried by Speed-Vac centrifugation.
Proteins were digested in situ in the gel pieces by adding a few microlitres of 0.1 μg/ml trypsin solution (Trypsin Gold mass spectrometry grade, Promega, Madison, WI), which had been prepared by diluting 1 mg/ml trypsin in 50 mM acetic acid with 25 mM NH4HCO3. The gel pieces were covered with ACN/10 mM NH4HCO3 (10/90) and incubated at 37°C overnight.
The tryptic protein fragments were collected from the supernatant. Additionally, two extractions were performed by shaking the gel pieces with ACN/1% formic acid (10/90) for 10 min at RT and then ACN/1% formic acid (50/50), with collection of the supernatant each time. Finally, the volume of the pooled supernatants was reduced to about 7 μl in a Speed-Vac centrifuge.
The tryptic peptides were mixed with 0.3 μl concentrated formic acid and 0.1 % trifluoroacetic acid (TFA) to a final volume of 15 μl and analysed by mass spectrometry.
Peptide Mass Fingerprinting
For analysis with matrix-assisted laser-desorbed ionisation (MALDI) - time-of-flight (ToF) - MS, 1 μl protein sample was directly applied onto a MALDI target, mixed with 1 μl α-cyano-4-hydroxycinnamic acid matrix (0.3 mg/ml in ethanol/acetone (2:1), Sigma Chemicals) and dried out. The spot was then briefly washed with 5 – 10 μl 10 mM ammonium phosphate in 1 % TFA and dried. Finally, proteins were re-crystallized by applying 1 μl ethanol/acetone/0.1 % TFA (6:3:1) and dried again. One μl of a solution of peptide calibration standard (external peptide calibration standard II PN: 222570, BRUKER Daltonic GmbH, Leipzig, Germany) in 5 μl matrix was applied at standard locations on the target.
The samples were analyzed using MALDI-ToF MS (Ultraflex, Bruker Daltonics) and mass spectra were calibrated externally using the peptide standard calibration curve ranging from 757 to 3147 Dalton. The instrument’s mass resolution was about 1 ppm. However, for routine analysis, mass accuracy of 50 ppm was accepted (as measured with internal calibrants in the mass spectrum, i.e. trypsin autocatalytic peaks at m/z 842.51, 1045.56 and 2211.10). The obtained monooisotopic peptide mass maps were compared to protein databases NCBInr, MSDB and SwissProt by using the Mascot search engine (Matrix Science Inc., Boston, MA).
Peptide sequencing
Tryptic fenugreek peptides were analysed by reverse-phase nano-scale liquid chromatography nanoelectrospray quadrupole-iontrap mass spectrometry (nanoLC ESI-MS/MS) on an Agilent 1100 HPLC-system equipped with a nanopump and an Agilent LC/MSD Trap XCT Plus (Agilent Technologies, Palo Alto, CA) mass spectrometer. Peptides were separated using a Zorbax C18 column (75 μm ID × 10 cm, 300Å porosity, 5 μm particles) (Agilent Technologies) and eluted by a gradient of solvent A (0.1 % formic acid) and solvent B (90 % ACN, 0.1 % formic acid) at a flow rate of 300 nl/min. The gradient was ramped from 3 to 8 % solvent B in 1 min, from 8 to 45 % solvent B in 85 min, and finally to 90 % B in 5 min, until it was returned to the initial conditions after 10 min. The peptides were loaded onto the column by way of a micro-well plate autosampler and a capillary pump flowing at 15 μl/min. Loading time was typically 2 min, and there was no split flow between loading and the gradient.
Spray was established using 8 μm ID emitters (New Objective, Inc.) and a typical capillary voltage of 1600 V. Spectra were collected over 350–1800 m/z. Three fragmentation spectra were collected for the three most abundant m/z values. Subsequently those masses were excluded from analysis for 1 min and the next three most abundant m/z values were selected for fragmentation to enable analysis of lower abundance peptide ions.
The Spectrum Mill database search algorithm (Agilent Technologies) was used to search the NCBInr and UniProt databases, employing the taxonomy filter for Other Green Plants. Parameters used for the search included the monoisotopic mass, a peptide mass tolerance of 1.2 Da and a fragment ion mass tolerance of 0.7 Da. Furthermore, tryptic peptides were only allowed two missed cleavages, and carbamidomethylation of cysteine was chosen as a fixed modification. Post-translational modifications (glycosylations and/or phosphorylations) as possible variable peptide modifications were not taken into consideration, the goal of the present study was to obtain protein identifictions.
Database matches were validated by reverse database scoring using SpectrumMill software. Proteins with SpectrumMill scores above 13, peptide scores above 10 and scored percent intensity (SPI) of 70% were used as a cutoff for initial “hit” validation. Each designated protein required validation of least 2 unique peptides. Additionally performed MASCOT-derived characterisations required protein scores to be above the significance threshold (p<0.05) and peptide expectation values below 10E-5. All peptide determinations used for protein characterisations were manually validated by marking observed and theoretically expected mass ions. Water losses first became evident when peptide fragments containing a serine (S) or threonine (T) were measured and were used to assist in sequence assignment validation.
Results
Determination of allergenic fenugreek proteins by using patient sera
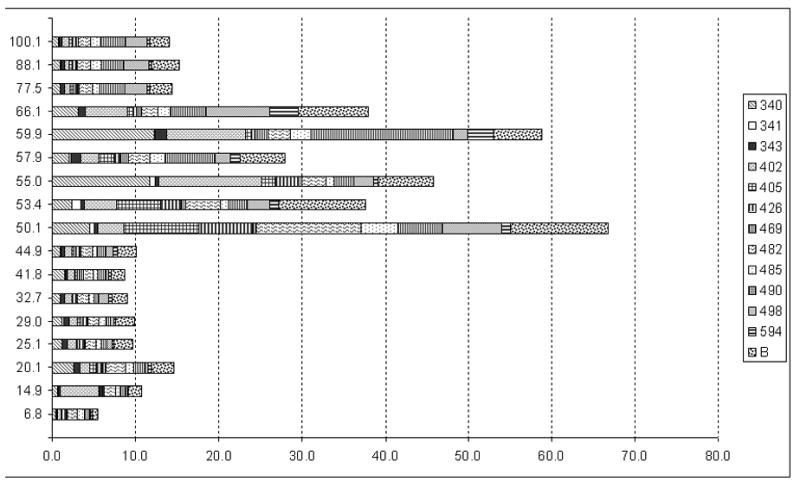
The Nor Food Allergy Reg has received sera of patients with suspected fenugreek allergy [16] since 2006. The present study includes 12 patients with antifenugreek IgE levels of classes 1 to 4 (0.4 to 36.4 kU/L) and a young child (ID 405) with a history of anaphylaxis to curry-containing food (Table 1). All patients were sensitised to peanut. The patient sera were used to determine allergenic fenugreek proteins on immunoblot. The signal intensities of 17 individual protein bands ranging from 6.8 kDa to 100.1 kDa were determined using dedicated image analyzing software (Figure 1a). For each protein, the normalized maximum optical densities were summed up for all patients (Figure 1b). Fenugreek proteins in the range from 50.1 kDa to 66.1 kDa showed considerably strong IgE-binding activities, appearing like a protein quintet with bands at 50.1 kDa, 55 kDa, 57.9 kDa, 59.9 kDa and 66.1 kDa in most of the blot lanes. For certain patient sera (ID 341, ID 402, ID 482, B) an additional band at 53 kDa was observed. For two patient sera (ID498, B), notably strong IgE-binding to several high molecular weight proteins (> 75 kDa) was observed, whereas four proteins of lower molecular weights (20.1 kDa, 25.1 kDa, 29.0 kDa, 32.7 kDa) elicited signals of medium intensities in almost all sera and strong signals in only a few (ID402, ID498, B). Taken together, results (Figure 1) demonstrate that the binding activity of the 50.1 kDa protein is the strongest of the fenugreek proteins and was the most consistent in all patient sera analysed.
Table 1.
Patients registered by the Norwegian Register and Reporting System for Severe Allergic Reactions to Food with IgE to fenugreek and peanut, and a history of anaphylaxis to spiced foods.
| Patient ID | Age | Sex | fenugreek | peanut | ||
|---|---|---|---|---|---|---|
| class | IgE kU/l | class | IgE kU/l | |||
| 340 | 18 | f | 3 | 11.4 | 5 | 66.5 |
| 341 | 13 | m | 1 | 0.45 | 2 | 2.63 |
| 343 | 9 | m | 1 | 0.42 | 6 | >100 |
| 402 | 25 | m | 3 | 5.05 | 3 | 6.04 |
| 405 | 1 | f | 0 | < 0.35 | 3 | 15.2 |
| 426 | 20 | f | 2 | 3.44 | 2 | 2.42 |
| 469 | 37 | m | 1 | 0.70 | 3 | 3.81 |
| 482/A* | 11 | m | 3 | 15.9 | 6 | >100 |
| 485 | 24 | m | 3 | 8.73 | 4 | 40.5 |
| 490 | 21 | f | 2 | 1.66 | 4 | 25.5 |
| 498 | 30 | f | 3 | 6.50 | 5 | 53.0 |
| 594 | 17 | m | 2 | 1.37 | 2 | 3.16 |
| B* | 12 | m | 4 | 36.4 | 6 | >100 |
These patients were additionally prick-tested and orally challenged with fenugreek seed extract.
Figure 1.
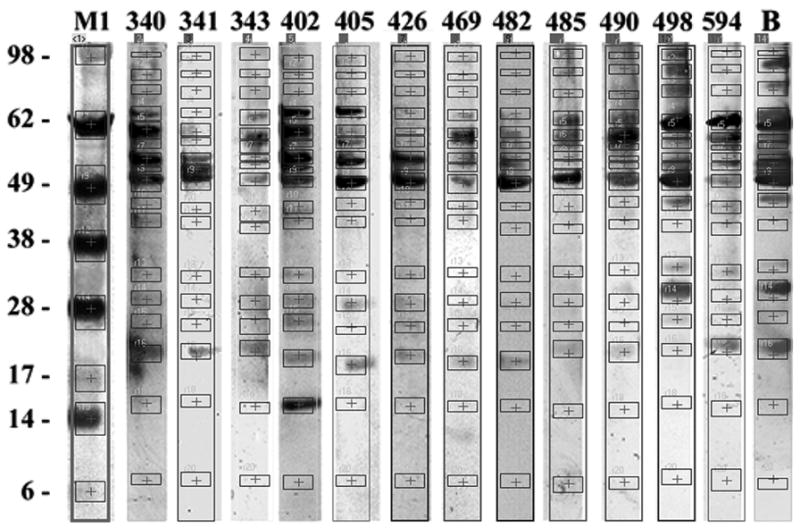
a. Immunoblot with whole native fenugreek seed extract using sera of fenugreek-sensitized patients (s. Table 1). Applying GelPro Analyzer® Image Analysis, 17 protein bands of interest were detected and IgE-binding intensities were determined. M1: SeeBluePlus2 molecular weight marker; relative protein molecular weights [kDa] are indicated on the left.
b. Bar Chart showing combined binding intensities for each of the 17 signals. Protein molecular weights as determined by GelPro Analyzer® are given on the ordinate, relative maximum optical densities on the abscissa. The contributions of individual patients to the combined results are marked by different patterns as shown in the legend.
Characterization of fenugreek proteins by peptide mass fingerprinting
Tryptic peptides of 17 fenugreek proteins (Figure 2) were analyzed by MALDI-ToF mass spectrometry and the mass patterns obtained were compared to the database entries of proteins from green plants. Peptides with homologies to known allergens were determined for 11 of the 17 analysed protein bands (Table 2).
Figure 2.

Coomassie-stained SDS-PAGE of whole fenugreek seed extract. Protein bands corresponding to the 17 labels were excised, digested with trypsin, and subjected to mass spectrometric analysis. M1: Mark12 molecular weight marker; M2: See Blue Plus molecular weight marker. Relative protein sizes [kDa] are listed on the sides of the gel.
Table 2.
Peptide Mass Fingerprinting (MALDI-Tof MS): Fenugreek peptides in electrophoresis gel fractions showed homologies to known allergens.
| Protein family | Allergen name, organism | Accession no. [23] | MW [kDa] | No. * | Gel [kDa] | Peptid. match. | Search Score | Sequence coverage |
|---|---|---|---|---|---|---|---|---|
| 7 S vicilin-like proteins | allergen len c 1.0101 (Lens culinaris) | Q84UI1 | 47.8 | 17 | 110 | 16 | 51 | 38 % |
| 16 | 98 | 19 | 54 | 41 % | ||||
| 11 | 50 | 7 | 31 | 25 % | ||||
| allergen len c 1.0102 (Lens culinaris) | Q84UI0 | 47.4 | 16 | 98 | 17 | 38 | 35 % | |
| cupin (Medicago trunculata) | Q2HW18 | 53.3 | 17 | 110 | 15 | 41 | 30 % | |
| 11 | 50 | 8 | 35 | 19 % | ||||
| provicilin (Pisum sativum) | P02854 | 46.4 | 16 | 98 | 16 | 34 | 32 % | |
| provicilin (Pisum sativum) | P02855 | 31.5 | 15 | 80 | 9 | 36 | 42 % | |
| 8 | 33 | 8 | 34 | 39 % | ||||
| vicilin A prec. (Pisum sativum) | A03345 | 31.5 | 14 | 68 | 10 | 34 | 37 % | |
| vicilin prec. (Pisum sativum) | P13918 | 52.2 | 6 | 24 | 27 | |||
| vicilin prec. (Vicia narbonensis) | Q41677 | 52.4 | 14 | 68 | 15 | 36 | 33 % | |
| allergen Ara h 1 (Arachis hypogaea) | P43238 | 71.3 | 3 | 10 | 11 | 24 | 24 % | |
| beta-conglutin (Lupinus albus) | Q6EBC1 | 62.1 | 11 | 50 | 8 | 34 | 21 % | |
| 11 S legumin-like proteins | legumin-like protein (Zea mays) | Q6Y4Q3 | 40.2 | 16 | 98 | 11 | 36 | 48 % |
| allergenic protein (Fagopyrum tataricum) | AAK97787 | 22.1 | 16 | 98 | 7 | 39 | 44 % | |
| 11 S globulin pre. isoform 3 (Sesam indicum) | Q2XSW7 | 55.5 | 9 | 38 | 5 | 20 | 16 % | |
| 2S albumins | 2S albumin (Curcubita maxima) | Q39649 | 16.6 | 15 | 80 | 8 | 32 | 60 % |
| phatogenesis-related proteins 10 | pollen allergen Bet v1 (Betula verrucosa) | P43176 | 17.6 | 5 | 21 | 9 | 26 | 65 % |
| Ole e1-like proteins | pollen allergen Lig v1 (Ligustrum vulgare) | O82016 | 16.7 | 5 | 21 | 8 | 28 | 60 % |
| expansin-like proteins | pollen allergen Pla l1 (Plantago lanceolata) | P82242 | 14.8 | 16 | 98 | 7 | 41 | 52 % |
| pollen allergen Lol p1 (Lolium perenne) | P14946 | 27.7 | 2 | 6 | 8 | 59 | 25 % | |
| gr. 1 allergen Dac g1.01 (Dactylis glomerata) | Q7XAX8 | 26.5 | 2 | 6 | 6 | 39 | 25 % | |
| patatin-like proteins | patatin (Vigna unguiculata) | Q9AQT8 | 43.6 | 14 | 68 | 13 | 39 | 39 % |
| cereal prolamins | avenin (Avena sativa) | P27919 | 24.2 | 13 | 61 | 4 | 22 | 28 % |
protein band number on SDS-gel (Figure 2)
The best search score was obtained for a fenugreek protein with homologies to 7 S vicilin-like proteins of other legume plants like the major lentil (Lens culinaris) allergen Len c 1, barrel clover (Medicago trunculata) cupin, pea (Pisum sativum) vicilin, vetch (Vicia narbonensis) vicilin, and the known allergens Ara h 1 from peanut (Arachis hypogaea) and beta-conglutin from lupin (Lupinus albus). The potential fenugreek vicilin-like protein was mainly detected in gel bands ranging from 50 kDa to 110 kDa, with a maximum of 19 peptide matches and sequence coverages of up to 42% when aligned to other plants’ proteins. However, several hits were also discovered in bands of lower molecular weight, suggesting the possibly of subunits of the protein. When comparing the position of the gel bands with the immunoblot intensities (Figure 1) it seems obvious that the fenugreek 7S vicilin-like protein is responsible for the strong IgE-binding signals at e.g. 50.1 kDa and 66.1 kDa.
The fenugreek protein detected at 38 kDa and 98 kDa showed considerable homologies to 11 S legumin-like proteins in plants like maize (Zea mays), Tartarian buckwheat (Fagopyrum tataricum) and sesame (Sesam indicum) (Table 2). Sequence coverage of 48% and up to 11 peptide matches were observed. Several known allergens from legume plants like peanut Ara h 3, peanut Ara h4 and lupin alpha-conglutin belong to the 11 S legumin-like protein family. The IgE-binding to proteins of molecular weights at about 30 kDa and above 75 kDa observed for patients ID498 and B might be caused by the presumptive fenugreek 11 S like protein (Figure 1).
Several other fenugreek proteins could be aligned to allergens from a number of different plants, although with smaller hit rates (Table 2). A fenugreek 2 S albumin was suggested by homology to the squash (Curcubita maxima) protein reaching 60% sequence coverage in 8 matched peptides. Furthermore, a 21 kDa fenugreek protein matching with 9 peptides to the major birch (Betula verrucosa) pollen allergen Bet v1 and obtaining 65% sequence coverage was detected. A fenugreek protein with homology to the Ole e1-like pollen allergen Lig v1 from wild privet (Ligustrum vulgare) was discovered in the same gel band, showing 60% sequence coverage in 8 peptides. A potential fenugreek expansin-like protein was detected both at low and high molecular bands by homologies to known pollen allergens of English plantain (Plantago lanceolata), ryegrass (Lolium perenne) and orchard grass (Dactylis glomerata), showing up to 52% sequence coverage in 7 matched peptides. Finally, fenugreek proteins with homologies to patatin from cowpea (Vigna unguiculata) and to oat avenin (Avena sativa) were detected, though their sequence coverages were less than 40%.
Characterization of fenugreek proteins by peptide sequencing
The identities of the two fenugreek proteins preliminarily described as 7 S vicilin-like and 11 S legumin-like proteins in the mass fingerprinting experiments were confirmed by peptide sequencing using nanoLC ESI-MS/MS.
The potential fenugreek 7 S vicilin-like protein, designated “Tri f 1” in analogy to peanut Ara h 1, was sequenced from the main IgE-binding band at 50.1 kDa (Figure 1), corresponding to protein band No. 11 on the SDS-gel (Figure 2). From the same band, a peptide mass fingerprint was retrieved and yielded a number of predicted peptide sequences (Figure 3a). The tandem MS experiment afforded the characterisation of six different peptide sequences, two of which were homologous. The sequence assignments were additionally manually validated (Figure 3b). Comparison to the peptide sequences predicted by fingerprinting revealed good correlation. The “Tri f 1” sequences retrieved by peptide sequencing and mass fingerprinting were combined and aligned to known 7S vicilin-like allergens from four other legume plants (Figure 3c). The alignment of “Tri f 1” to Ara h 1(pea nut), Pis s 1 (pea), Len c 1 (lentil), and beta-conglutin (lupin) showed a large number of identical and homologous amino acids in the five protein sequences, especially in the C-terminal regions. “Tri f 1” peptide sequences determined in this study were highly homologous to Pis s 1 and Len c 1 whereas there was greater deviation with Ara h 1 and beta-conglutin. However, comparison of the sequenced “Tri f 1”-peptides to the corresponding Ara h 1-domains revealed sequence identity for 55% of the 80 amino acids that were determined in this study. Additionally, sequence homology was found in further 29% and similarity in additional 6.3%.
Figure 3.


a. MALDI-ToF mass spectrum of peptides from a 50 kDa-fenugreek protein (s. band 11 in Figure 2) digested with trypsin. A list of measured protonated masses and the respective peptides as predicted by match to known 7S vililin-like proteins is shown in the table.
b. NanoLC-MS/MS fragmentation mass spectra obtained by collisional dissociation of peptides with m/z 803.7 (upper panel) and m/z 630.9 (lower panel) generated by trypsin digestion of the 50 kDa fenugreek protein band (7S vicilin-like protein). “◇” identifies the m/z-value of the double-charged parent ion. Loss of water is indicated by “°” and loss of ammonia by “*”. PAG: proline-dependent internal cleavage ion. Amino acid sequences and predicted single- and double-charged b- and y-type fragment ions are shown above the two spectra. Ions that were observed are underlined in bold. 83% of the expected amino acids were observed for each peptide and all dominant ions were accounted for.
c. Protein sequence alignment (Cluster Alignment by T-Coffee (www.tcoffee.org), Jalview Version 2) [22] of fenugreek 7S vicilin-like peptide sequences (“Tri f 1”) to known legume allergens from pea (Pis s 1), lentil (Len c 1), lupin (beta-conglutin), and peanut (Ara h 1). The sequences were retrieved from the UniProt database [23], s. accession numbers). The presented Tri f 1 data is comprised of peptides characterised by nanoLC-MS/MS sequencing (marked as boxes) and the peptides predicted by mass fingerprinting (showing two or three alternative amino acids in some positions). The greyscales indicate levels of amino acid homology between the aligned sequences: dark grey: 100 % identity; medium grey: 66 % identity; light grey: 50 % identity.
The presumptive fenugreek 11 S legumin-like protein was designated “Tri f 3” in analogy to Ara h 3 from peanut. Three peptide sequences from the C-terminus of the protein were determined by sequencing the IgE-binding band at 20.1 kDa (Figure 1), corresponding to protein band No.5 on the SDS-gel (Figure 2). Two additional peptides were retrieved from IgE-binding bands ranging from 50 kDa to 80 kDa (Figure 1), i.e. bands No. 11 to 14 on the gel (Figure 2). In total, sequence assignments for five peptides were manually validated (Figure 4a). The combination of the “Tri f 3” sequences obtained by peptide sequencing and mass fingerprinting and their alignment to three known 11 S legumin-like allergens from other legume plants, Ara h 3 (peanut), Piss legumin (pea) and Gly m6 (soy) showed good coverage at the N- and C-termini of the protein (Figure 4b). In contrast, sequence information on the midsection of “Tri f 3” could not be obtained in the present study. The sequence comparison of “Tri f 3” and Ara h 3 showed sequence identity for 54% of the in total 91 amino acids determined so far. Additionally, 22 % homology and 6.6 % similarity were found.
Figure 4.


a. NanoLC-MS/MS fragmentation mass spectra obtained by collisional dissociation of peptides with m/z 695.5 (upper panel), generated by trypsin digestion of the 53 kDa fenugreek protein band, and m/z 614.7 (lower panel), generated by trypsin digestion of the 20 kDa fenugreek protein band (both belonging to the 11S vicilin-like protein). “◇” identifies the m/z-value of the double-charged parent ion. Loss of water is indicated by “°” and loss of ammonia by “*”. PD: proline-dependent internal cleavage ion. Amino acid sequences and predicted single- and double-charged b- and y-type fragment ions are shown above the two spectra. Ions that were observed are underlined in bold. 88% and 73% of the expected amino acids were observed for each peptide, respectively.
b. Protein sequence alignment (Cluster Alignment by T-Coffee (www.tcoffee.org), Jalview Version 2) [22] of fenugreek 11S legumin-like peptide sequences (“Tri f 3”) to known legume allergens from pea (Pis s legumin), soy (Gly m 6.05), and peanut (Ara h 3). The sequences were retrieved from the UniProt database [23], s. accession numbers). The presented “ Tri f 3” data is comprised of peptides characterised by nanoLC-MS/MS sequencing (marked as boxes) and the peptides predicted by mass fingerprinting (showing two alternative amino acids in some positions). The greyscales indicate levels of amino acid homology between the aligned sequences: dark grey: 100 % identity; medium grey: 66 % identity; light grey: 50 % identity.
Comparison of potential fenugreek to known peanut allergens
The potential fenugreek allergens that were characterised by the different experiments in this study demonstrated a considerable homology to known peanut allergens (Table 3). Representatives of at least four important families of allergenic proteins were determined in fenugreek. The 7 S vicilin-like allergen “Tri f 1” and the 11 S legumin-like allergen “Tri f 3”, homologues of respectively Ara h 1 and Ara h 3, were confirmed by protein sequencing using tandem mass spectrometry and database seraching. In contrast, fenugreek 2 S albumin, preliminarily called “Tri f 2” and fenugreek phatogenesis-related protein 10, “Tri f 4”, have only been characterised by peptide mass fingerprinting so far.
Table 3.
Potential allergens in fenugreek.
| potential fenugreek allergens | protein family | confirmed by | homologous peanut allergens |
|---|---|---|---|
| “Tri f 1” | 7 S vicilin | sequence data | Ara h 1 |
| “Tri f 3” | 11 S legumin | sequence data | Ara h 3, Ara h4 |
| “Tri f 2” | 2 S albumin | mass fingerprint | Ara h 2, Ara h 6, Ara h 7 |
| “Tri f 4” | PR-10 protein | mass fingerprint | Ara h 8 |
Discussion
Allergy to fenugreek is in the majority of cases correlated to peanut allergy. Sensitization to fenugreek can occur in peanut-allergic patients by exposure to fenugreek-containing foods, probably as a consequence of an extensive cross-reactivity [16, 19], suggesting homologous IgE-binding epitopes in both legume plants [10, 16, 24]. Cross-reactivities between other closely-related members of the Leguminosae family such as peanut, soy and lupin have previously been documented [4–6, 15, 19, 25].
Determination of allergenic fenugreek proteins by patient serum analysis
In the present study, sera of 13 patients with histories of anaphylaxis to fenugreek were used to determine allergenic fenugreek proteins. Immunoblot experiments with fenugreek seed proteins showed individual IgE-binding patterns for each patient comparable to those found in a previous experiment [16]. However, in the present study we used image analysis software for the determination of molecular weights, which resulted in fenugreek protein sizes slightly differing from the previously only estimated values. Summing up the new and more precise results, a cluster of high-affinity proteins ranging from 50.1 to 66.1 kDa and another less pronounced cluster at 20.1 to 32.7 kDa were revealed.
This band distribution is consistent to the results which have been observed for other legume plants [25]. IgE-binding to major peanut allergens was found on immunoblot for the homotrimeric 7S-cupin Ara h 1 at 60–63 kDa, for the proteolytical acidic and basic subunits of the hexameric 11 S-cupin Ara h 3 isoforms mainly at 40 kDa and 25 kDa, respectively, and for the 2S albumin Ara h 2 in a double band at 18 and 20 kDa, and Ara h 6 at 16 kDa [25 – 28].
In a follow-up study, the present one-dimensional proteomic analysis could be refined by performing two-dimensional gel electrophoresis and immunoblotting to more specifically excise and identify proteins exhibiting IgE-binding.
Characterization of fenugreek proteins by mass fingerprinting
The allergome of fenugreek was further studied by mass fingerprinting. Peptide mass fingerprinting is an appropriate method for protein characterization if certain parameters like fixed modifications (e.g. cysteine alkylation) are included and only a restricted number of trypsin miscleavages are permitted [29]. Successful sequence database searching is dependent on the degree to which the organism of origin is represented and relies on the presence of homologous proteins as a minimum requisite. By limiting the search to “Other Green Plants”, excluding the otherwise dominant entries of the completely sequenced thale cress (Arabidopsis thaliana) and rice (Oritza sativa), the hit rates were optimised in the present study.
A number of fenugreek proteins belonging to known allergen protein families as specified by PFAM (http://www.sanger.ac.uk/software/pfam) [30] and AllFAM (http://www.meduniwien.ac.at/allergens/allfam) [11] were discovered.
Several of the bands in the fenugreek seed extract contained peptides, homologous to 7S-vicilins and 11S-legumins in the cupin superfamily [17] (PF00190/AF045), the second largest AllFAM-family containing 36 identified plant food allergens so far [11]. The number of fenugreek peptides matched to major legume seed allergens like Ara h 1 from peanut [13, 26], Len c 1 from lentil, and Pis s 1 from pea, as well as the search score and sequence coverage, make a convincing case for the presence of a homologous 7S vicilin-like fenugreek protein in the most intensively IgE-binding bands on the gel. Furthermore, a potential fenugreek 11S legumin-like protein was determined by homology to allergens like Fag t 1 from Tatarian buckwheat and Ses i 6 or Ses i 7 from sesame.
It was also possible to determine a number of fenugreek proteins with homologies to different protein families, although lower hit rates and search scores decrease the degree of certainty. A potential fenugreek 2S albumin was suggested by matching to a protein from squash. The 2S albumin family, including a considerable number of seed and tree nut allergens like Ara h 2, Ara h 6 and Ara h 7 [14], belongs to the prolamin superfamily (PF00234/AF050), the largest A11FAM-family with 63 identified plant food allergens to date. Ara h 2 has been described as the most potent peanut allergen [15], and the presence of a homologous fenugreek allergen could be expected. However, the Tris-glycine pH 8.7 extraction buffer used in the present study might be not optimal for prolamin extraction since the recoveries (as measured by gel electrophoresis band intensities) for Ara h 2 and the corresponding fenugreek protein were low. The postulated fenugreek 2S-albumin may be confirmed in a further study by changing the extraction conditions and using two-dimensional gels for more precise separation and identification.
Fenugreek PR-10 protein was found by homology to the major birch pollen allergen Bet v1. The Bet v1-related proteins are classified as an autonomous A11FAM family (PF00407/AF069) containing closely-related, cross-reactive pollen allergens from plant families like Fabaceae (e.g. peanut Ara h 8) [13], Rosaceae (e.g. hazelnut Cor a 1) and Apiacea (e.g. celery Api g 1).
A protein with homology to the Ole e1-related allergen Lig v1 from wild privet was detected in a 21 kDa band of the fenugreek extract. Ole e1-like proteins (AF087/PF01190) are extracellular plant pollen glycoproteins of unknown biological function containing six conserved cysteine residues. The glycan moieties have been found to take part in IgE binding. By now, allergens from this protein family have been characterized only in Oleacea trees, grass pollen and weed pollen, so that the presence of a homologous fenugreek allergen has to be considered as rather unlikely and should be examined by further experiments.
In the fenugreek gel bands at 6 kDa and 98 kDa, peptides with considerable sequence homologies to three members of the expansin superfamily [31] (C-terminal domain: PF01357/AF093 and N-terminal domain: PF03330/AF094) were observed. Expansins are plant cell wall glycoproteins with cell-wall loosening activity and consist of a poorly conserved N-terminus and a beta-sandwiched C-terminus. The glycan moieties are involved in the IgE-binding. However, expansins from grass pollen are the only ones proven to be allergenic, and therefore this potential fenugreek expansin may not, in fact, have IgE-binding activity.
Finally, fenugreek peptides with likeness to patatin and avenin were found at 68 kDa and 61 kDa, respectively. The patatin family (PF01734/AF104) includes glycosylated storage proteins with phospholipase activity. Two patatins from different plant families have been found to be allergenic so far. A more detailed study of the fenugreek proteins would be needed to confirm the presence of an allergenic fenugreek patatin. In contrast, the score and matched peptides for the avenin hit made it the least plausible result from the peptide mass fingerprinting. Avenin, the oat prolamin (PF00234/AF050), accounts only rather seldom for allergic reactions. Furthermore, alcohol-soluble avenin-like proteins would only be present in low numbers in the hydrophilic fenugreek extract.
Characterization of fenugreek 7S-like and 11S-like globulins by MS-based protein sequencing
Protein de novo sequencing can be used for homology-based searches to enable cross-species identification [29]. However, it is necessary to note that sequences derived from MS/MS-spectra will probably contain some ambiguities due to e.g. missed tryptic cleavages on the C-terminal side of proline and incomplete series of the fragment y- and b-type ions. Since the automated software-controlled peptide identification in some cases may generate high scores that are not correct, every sequence assignment was inspected by manual spectra interpretation in this study.
A number of fenugreek peptides sharing homologies to known cupin-type seed storage allergens from other legume plants were verified. From the six peptides that were characterised in the potential fenugreek 7S vicilin-like protein, three (FEITPEK; RNFLAGEEDNVISQIQRPVKEL and isoform RNFLAGEEDNVISQVERPVKEL) were homologous to known IgE-binding epitopes in the major peanut allergen Ara h 1 [26, 32]. The determination of two fenugreek isoformic peptides in the C-terminal sequence segment, which has been shown to be especially stable and was used as biomarker in the quantitative MS analysis of peanut in foods [33], may indicate the presence of two distinct “Tri f 1”-isoforms. Two isoforms (Uniprot database entries: P43238 and P43237) have been identified for peanut Ara h 1 thus far.
In the potential fenugreek 11S legumin-like protein, five peptides were characterised, two of which are connected. One sequenced peptide (TETWNPNHPELKCAG) from the acidic N-terminal subunit of the protein was homologous to a known IgE-binding epitope of the peanut allergen Ara h 3 [27]. Additionally, a fenugreek peptide (NLNALEPDHR) in the same domain, and one peptide (RLQVVNCNGNTVFDGELEAG) from the basic C-terminal subunit were homologous to Ara h 3-peptides, which have been found to be especially stable and were used as markers in quantitative MS-analysis [28, 32, 34].
While sequence identity alone cannot be used as a definitive identifier of allergens, considering that the nature of allergenicity is local [35], it has proven a useful tool for the comparison of the physicochemical properties of discrete areas of allergenic proteins to known IgE epitopes. The typical IgE-epitope length spans between 6 and 15 amino acids. Sequence motif characteristics of allergenic proteins in protein families were developed and used to determine fingerprints for allergenicity for the establishment of a Structural Database of Allergenic Proteins (S DAP; http://fermi.utmb.edu/SDAP/). Testing of the three “Tri f 1”-peptides with homologies to Ara h 1-epitopes and the “Tri f 3”-peptide homologous to an Ara h 3 -epitope in SDAP revealed significantly low scores on the physicochemical property distance scale (PD < 5) confirming the high probability of allergenic cross-reactivity between fenugreek and peanut.
Potential fenugreek allergens
Sequence comparisons and assignments to protein families provide a molecular basis for clinical cross-reactions [36]. The patient data presented in the present and two previous studies [16, 19] give strong indication for a rather extensive fenugreek-peanut cross-allergenicity. The fenugreek allergens characterised have been preliminarily named in correlation to major peanut allergens as per the guidelines of the Allergen Nomenclature Sub-Committee of the World Health Organisation and International Union of Immunological Societies (WHO/IUIS) [36]. The characterization of “Tri f 1” and “Tri f 3” is a result of protein sequence determination and seems to be without ambiguity. The presence of two isomeric peptides in the C-terminal IgE-binding epitope of “Tri f 1” leads to postulating the existence of polymorphic isoforms of this fenugreek allergen (“Tri f 1.0101” and “Tri f 1.0102”). In contrast, the determination of “Tri f 2” and “Tri f 4” is based on peptide fingerprinting experiments alone and requires verification. For admission to the allergen database and official inclusion into the nomenclature, the fenugreek allergens will have to be further purified and defined in regards to their molecular properties.
Conclusion
Potential fenugreek (Trigonella foenum-graecum) allergens were characterised using IgE-binding and proteomic analytics. Significant homologies to major peanut allergens could explain the proliferation of secondary fenugreek allergy by cross-reactivity in peanut allergic patients.
Acknowledgments
This study has been supported by research grants from the Norwegian Research Council and the NIH/NIDDK (5 P30 DK04 8520-09).
The authors would like to thank Prof. Martinus Løvik and Dr. Ellen Namork at the Norwegian Institute for Public Health for their participation in our fruitful discussions. Lena Haugland Moen at the National Veterinary Institute is gratefully acknowledged for her technical assistance and Jamie Henthorn for proof-reading the manuscript. The MALDI-ToF MS experiments were performed in commission by Otto A. Bårholm at the Proteomic Unit at the University of Bergen (PROBE), Norway.
Abbreviations
- m/z
mass-to-charge ratio
- MALDI-ToF MS
matrix-assisted laser-desorbed time-of-flight mass spectrometry
- nanoLC ESI-MS/MS
nano-liquid chromatography electrospray ionisation tandem mass spectrometry
- NorFoodAllergyReg
Norwegian National Register and Reporting System for Severe Allergic Reactions to Food
- OD
optical density
Footnotes
Publisher's Disclaimer: This is a PDF file of an unedited manuscript that has been accepted for publication. As a service to our customers we are providing this early version of the manuscript. The manuscript will undergo copyediting, typesetting, and review of the resulting proof before it is published in its final citable form. Please note that during the production process errors may be discovered which could affect the content, and all legal disclaimers that apply to the journal pertain.
References
- 1.Rao PU, Sesikeran B, Rao PS, Naidu AN, Rao VV, Ramachandran EP. Short term nutritional and safety evaluation of fenugreek. Nutr Res. 1996;16:1495–505. [Google Scholar]
- 2.Patil SP, Niphadkar PV, Bapat MM. Allergy to fenugreek (Trigonella foenum graecum) Ann Allergy Asthma Immunol. 1997;78:297–300. doi: 10.1016/S1081-1206(10)63185-7. [DOI] [PubMed] [Google Scholar]
- 3.Dugué P, Bel J, Figueredo M. Fenugreek causing a new type of occupational asthma. Presse Med. 1993;22:922. [PubMed] [Google Scholar]
- 4.Lallès JP, Peltre G. Biochemical features of grain legume allergens in humans and animals. Nutr Rev. 1996;54:101–7. doi: 10.1111/j.1753-4887.1996.tb03883.x. [DOI] [PubMed] [Google Scholar]
- 5.Martínez SIM, Ibáñez SMD, Fernández-Caldas E. Hypersensitivity to members of the botanical order Fabales (legumes) J Investig Allergol Clin Immunol. 2000;10:187–99. [PubMed] [Google Scholar]
- 6.Pereira MJ, Belver MT, Pascual CY, Martin Esteban M. The allergenic significance of legumes. Allergol Immunopathol (Madr) 2002;30:346–53. doi: 10.1016/s0301-0546(02)79152-0. [DOI] [PubMed] [Google Scholar]
- 7.European Union. European Commission Directive 2006/142/EC of 22 December 2006 amending Annex IIIa of Directive 2000/13/EC of the European Parliament and of the Council listing the ingredients which must under all circumstances appear on the labelling of foodstuffs. Off J Eur Union. 2006:L368/110. [Google Scholar]
- 8.Grundy J, Matthews S, Bateman B, Dean T, Arshad SH. Rising prevalence of allergy to peanut in children: data from 2 sequential cohorts. J Allergy Clin Immunol. 2002;110:784–9. doi: 10.1067/mai.2002.128802. [DOI] [PubMed] [Google Scholar]
- 9.Bock SA, Muñoz-Furlong A, Sampson HA. Fatalities due to anaphylactic reactions to foods. J Allergy Clin Immunol. 2001;107:191–3. doi: 10.1067/mai.2001.112031. [DOI] [PubMed] [Google Scholar]
- 10.Breiteneder H, Mills EN. Molecular properties of food allergens. J Allergy Clin Immunol. 2005;115:14–23. doi: 10.1016/j.jaci.2004.10.022. [DOI] [PubMed] [Google Scholar]
- 11.Radauer C, Bublin M, Wagner S, Mari A, Breiteneder H. Allergens are distributed into few protein families and possess a restricted number of biochemical functions. J Allergy Clin Immunol. 2008;121:847–52. doi: 10.1016/j.jaci.2008.01.025. [DOI] [PubMed] [Google Scholar]
- 12.Kleber-Janke T, Crameri R, Appenzeller U, Schlaak M, Becker WM. Selective cloning of peanut allergens, including profilin and 2S albumins, by phage display technology. Int Arch Allergy Immunol. 1999;119:265–74. doi: 10.1159/000024203. [DOI] [PubMed] [Google Scholar]
- 13.Marsh J, Rigby N, Wellner K, Reese G, Knulst A, Akkerdaas J, van Ree R, Radauer C, Lovegrove A, Sancho A, Mills C, Vieths S, Hoffmann-Sommergruber K, Shewry PR. Purification and characterisation of a panel of peanut allergens suitable for use in allergy diagnosis. Mol Nutr Food Res. 2008;52:272–85. doi: 10.1002/mnfr.200700524. [DOI] [PubMed] [Google Scholar]
- 14.Lehmann K, Schweimer K, Reese G, Randow S, Suhr M, Becker WM, Vieths S, Rösch P. Structure and stability of 2S albumin-type peanut allergens: implications for the severity of peanut allergic reactions. Biochem J. 2006;395:463–72. doi: 10.1042/BJ20051728. [DOI] [PMC free article] [PubMed] [Google Scholar]
- 15.Dooper MM, Plassen C, Holden L, Lindvik H, Faeste CK. Immunoglobulin E cross-reactivity between lupine conglutins and peanut allergens in serum of lupine-allergic individuals. J Investig Allergol Clin Immunol. 2009;19:283–91. [PubMed] [Google Scholar]
- 16.Fæste CK, Namork E, Lindvik H. Allergenicity and antigenicity of fenugreek proteins (Trigonella foenum-graecum) in foods. J Clin Allergy Immunol. 2009;123:187–94. doi: 10.1016/j.jaci.2008.09.012. [DOI] [PubMed] [Google Scholar]
- 17.Ivanciuc O, Garcia T, Torres M, Schein CH, Braun W. Characteristic motifs for families of allergenic proteins. Mol Immunol. 2009;46:559–68. doi: 10.1016/j.molimm.2008.07.034. [DOI] [PMC free article] [PubMed] [Google Scholar]
- 18.Løvik M, Namork E, Fæste CK, Egaas E. The Norwegian National Reporting System and Register of Severe Allergic Reactions to Food. Norsk Epidemiologi. 2004;14:155–60. [Google Scholar]
- 19.Fæste CK, Namork E. Differentiated Patterns of legume sensitisation in peanut-allergic patients. Food Anal Methods. 2009 doi: 10.1007/s12161-009-9096-x. [DOI] [Google Scholar]
- 20.Barrett J, Brophy PM, Hamilton JV. Analysing proteomic data. Int J Parasitol. 2005;35:543–53. doi: 10.1016/j.ijpara.2005.01.013. [DOI] [PubMed] [Google Scholar]
- 21.Nesvizhskii AI. Protein identification by tandem mass spectrometry and sequence database searching. Methods Mol Biol. 2007;367:87–119. doi: 10.1385/1-59745-275-0:87. [DOI] [PubMed] [Google Scholar]
- 22.Waterhouse AM, Procter JB, Martin DMA, Clamp M, Barton GJ. Jalview Version 2 - a multiple sequence alignment editor and analysis workbench. Bioinformatics. 2009 doi: 10.1093/bioinformatics/btp033. [DOI] [PMC free article] [PubMed] [Google Scholar]
- 23.UniProt Consortium. The Universal Protein Resource (UniProt) 2009. Nucleic Acids Res. 2009;37:D169–74. doi: 10.1093/nar/gkn664. [DOI] [PMC free article] [PubMed] [Google Scholar]
- 24.Aalberse RC. Assessment of allergen cross-reactivity. Clin Mol Allergy. 2007;5:2–7. doi: 10.1186/1476-7961-5-2. [DOI] [PMC free article] [PubMed] [Google Scholar]
- 25.Jensen LB, Pedersen MH, Skov PS, Poulsen LK, Bindslev-Jensen C, Andersen SB, Torp AM. Peanut cross-reacting allergens in seeds and sprouts of a range of legumes. Clin Exp Allergy. 2008;38:1969–77. doi: 10.1111/j.1365-2222.2008.03129.x. [DOI] [PubMed] [Google Scholar]
- 26.Shin DS, Compadre CM, Maleki SJ, Kopper RA, Sampson H, Huang SK, Burks AW, Bannon GA. Biochemical and structural analysis of the IgE binding sites on Ara h 1, an abundant and highly allergenic peanut protein. J Biol Chem. 1998;273:13753–9. doi: 10.1074/jbc.273.22.13753. [DOI] [PubMed] [Google Scholar]
- 27.Rabjohn P, Helm EM, Stanley JS, West CM, Sampson HA, Burks AW, Bannon GA. Molecular cloning and epitope analysis of the peanut allergen Ara h 3. J Clin Invest. 1999;103:535–42. doi: 10.1172/JCI5349. [DOI] [PMC free article] [PubMed] [Google Scholar]
- 28.Piersma SR, Gaspari M, Hefle SL, Koppelman SJ. Proteolytic processing of the peanut allergen Ara h 3. Mol Nutr Food Res. 2005;49:744–55. doi: 10.1002/mnfr.200500020. [DOI] [PubMed] [Google Scholar]
- 29.Johnson RS, Davis MT, Taylor A, Patterson SD. Informatics for protein identification by mass spectrometry. Methods. 2005;35:223–236. doi: 10.1016/j.ymeth.2004.08.014. [DOI] [PubMed] [Google Scholar]
- 30.Finn RD, Tate J, Mistry J, Coggill PC, Sammut SJ, Hotz HR, Ceric G, Forslund K, Eddy SR, Sonnhammer EL, Bateman A. The Pfam protein families database. Nucleic Acids Res. 2008;36:D281–8. doi: 10.1093/nar/gkm960. [DOI] [PMC free article] [PubMed] [Google Scholar]
- 31.Sampedro J, Cosgrove DJ. The expansin superfamily. Genome Boil. 2005;6:242. doi: 10.1186/gb-2005-6-12-242. [DOI] [PMC free article] [PubMed] [Google Scholar]
- 32.Chassaigne H, Trégoat V, Nørgaard JV, Maleki SJ, van Hengel AJ. Resolution and identification of major peanut allergens using a combination of fluorescence two-dimensional differential gel electrophoresis, Western blotting and Q-TOF mass spectrometry. J Proteomics. 2009;72:511–26. doi: 10.1016/j.jprot.2009.02.002. [DOI] [PubMed] [Google Scholar]
- 33.Shefcheck KJ, Musser SM. Confirmation of the allergenic peanut protein, Ara h 1, in a model food matrix using liquid chromatography/tandem mass spectrometry (LC/MS/MS) J Agric Food Chem. 2004;52:2785–90. doi: 10.1021/jf035129h. [DOI] [PubMed] [Google Scholar]
- 34.Careri M, Costa A, Elviri L, Lagos JB, Mangia A, Terenghi M, Cereti A, Garoffo LP. Use of specific peptide biomarkers for quantitative confirmation of hidden allergenic peanut proteins Ara h 2 and Ara h 3/4 for food control by liquid chromatography-tandem mass spectrometry. Anal Bioanal Chem. 2007;389:1901–7. doi: 10.1007/s00216-007-1595-2. [DOI] [PubMed] [Google Scholar]
- 35.Ivanciuc O, Schein CH, Garcia T, Oezguen N, Negi SS, Braun W. Structural analysis of linear and conformational epitopes of allergens. Regul Toxicol Pharmacol. 2009;54:S11–9. doi: 10.1016/j.yrtph.2008.11.007. [DOI] [PMC free article] [PubMed] [Google Scholar]
- 36.Chapman MD, Pomés A, Breiteneder H, Ferreira F. Nomenclature and structural biology of allergens. J Allergy Clin Immunol. 2007;119:414–20. doi: 10.1016/j.jaci.2006.11.001. [DOI] [PubMed] [Google Scholar]