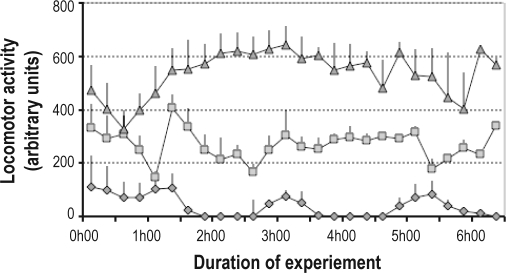
Figure 4.
Locomotor activity measured by infrared sensors during the 6 h of a separate sleep deprivation experiment. Each point represents a mean 15-min value and SEM for each group. Diamonds: CTL group (undisturbed control animals; n = 4), Triangles: MOD group (mice treated with modafinil; n = 3); Squares: GSD group (mice sleep deprived by the gentle sleep deprivation method; n = 4).

