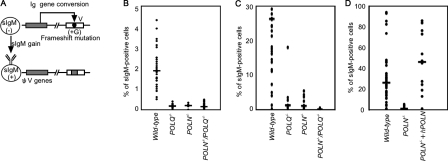
Figure 4.
Analysis of Ig gene conversion rate measured by sIgM gain. (A) Diagram of Ig gene conversion assay for DT40 cells. The frameshift mutation caused by the insertion of G in the rearranged Vλ segment in the parent cells is indicated by the circle. Gene conversion events using an upstream ΨV donor segment can eliminate the frameshift mutation, resulting in a gain in sIgM expression. The ΨV segment is indicated by the shaded box. (B) The kinetics of Ig gene conversion is evaluated by measuring the frequency of sIgM gain. The frequency of sIgM gain revertants of the indicated genotype was determined at 3 wk without TSA. We determined the percentage of sIgM gain variants from the following number of sIgM-negative subclones: wild type, 35; POLQ−/−, 22; POLN−/−, 13; and POLN−/−/POLQ−/−, 34. Wild-type data were described previously (Kawamoto et al., 2005; Nakahara et al., 2009). The horizontal bars in the panel indicate median percents. (C) The frequency of sIgM gain revertants of the indicated genotype was determined at 3 wk after addition of 1.25 ng/ml TSA. We determined the percentage of sIgM gain variants from the following number of sIgM-negative subclones: wild type, 14; POLQ−/−, 9; POLN−/−, 10; and POLN−/−/POLQ−/−, 6. (D) The frequency of sIgM gain revertants was determined at 3 wk after addition of 1.25 ng/ml TSA in POLN−/− clones reconstituted with human POLN cDNA. We determined the percentage of sIgM gain variants from the following number of sIgM-negative subclones: wild type, 39; POLN−/−, 10; and POLN−/− + hPOLN, 12.

