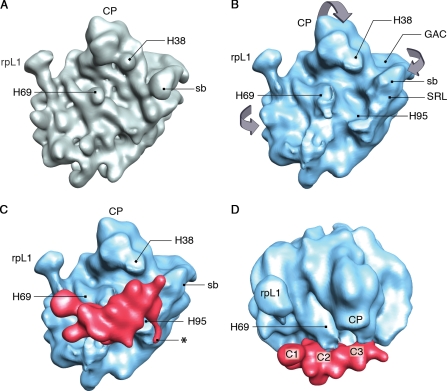
Figure 2.
Visualization of MBP-Nmd3 binding to the 60S subunit. (A) Intersubunit side view of the control 60S subunit. (B) Intersubunit view of the segmented 60S part of the MBP-Nmd3–60S reconstruction. Significant conformational changes are seen in the GAC, the SRL, the CP, and the region around the peptidyl-transfer center. The stalk base (sb), the L1 stalk (rpL1), and 25S rRNA helices 38, 69, and 95 (H38, H69, and H95) are also labeled. The direction of the motion of the intersubunit surface of the 60S subunit after MBP-Nmd3 binding is marked with arrows. (C) Intersubunit side view of the MBP-Nmd3–60S subunit complex. The segmented density attributed to the MBP-Nmd3 combined mass is colored red, whereas the 60S subunit is colored blue. The asterisk denotes the thread of density (see Identification of Nmd3–60S subunit interactions for details). (D) Top view of the complex showing three connections (C1, C2, and C3) of the MBP-Nmd3 mass (red) with the 60S subunit (blue).

