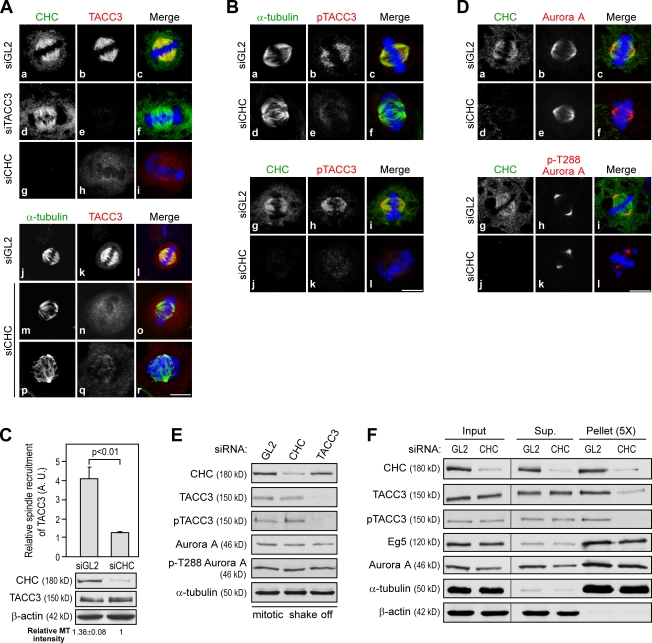
Figure 2.
CHC is essential for TACC3 localization to the spindle. (A, B, and D) Metaphase images of HeLa cells treated with the indicated siRNAs for 72 h and stained with DNA (blue), TACC3 (H-300), phospho-TACC3 (pTACC3), aurora A, or phospho-T288 aurora A (red) and CHC or α-tubulin (green) as indicated. Bars, 10 µm. (C) Histogram shows TACC3 recruitment to the spindle in HeLa cells treated with the indicated siRNAs. Expression levels of the indicated proteins in siRNA-treated cells are shown. Relative spindle recruitment and spindle MT intensity are quantified as described in Materials and methods. Error bars indicate mean ± SD (n = 3; >20 mitotic cells scored per experiment). (E and F) Western blots show the levels of indicated proteins from mitotic extracts of cells treated with indicated siRNAs (E) and the level of indicated proteins from in vitro aster and MT-binding assays with mitotic extracts of cells treated with the indicated siRNAs (F). Black lines indicate that intervening lanes have been spliced out. Sup, supernatant.

