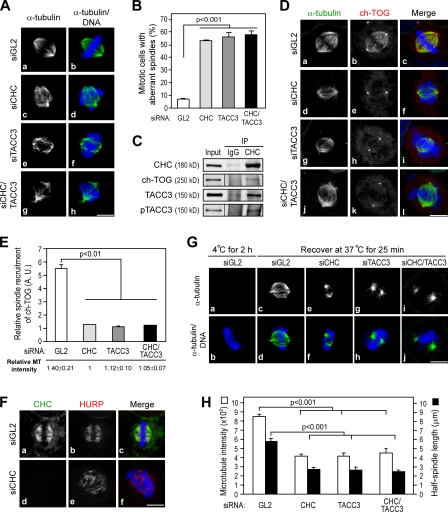
Figure 4.
Depletion of CHC and/or TACC3 renders a loss of ch-TOG spindle targeting and aberrant spindles. (A, D, and F) Images of HeLa cells treated with the indicated siRNAs and stained with DNA (blue), α-tubulin or CHC (green), and ch-TOG or hepatoma up-regulated protein (HURP; red) as indicated are shown. (B) Bar graph shows quantification of aberrant spindle morphology of cells as observed in A (n = 3; >100 cells per experiment). (C) Western blots show complex formation of endogenous CHC and ch-TOG by immunoprecipitation (IP) with the indicated antibodies from mitotic HeLa cells. Input represents the 5% amount of Noc-treated cell extracts subjected to immunoprecipitation. Black lines indicate that intervening lanes have been spliced out. (E) Bar graph shows the recruitment of ch-TOG to the spindle of cells observed in D (n = 3; >10 mitotic cells scored per experiment). (G) Images of MT repolymerization after cold shock of the indicated siRNA-treated cells. Cells were fixed and stained with α-tubulin (green) and DNA (blue). (H) Bar graph shows MT intensity and half-spindle length of cells observed in G (n = 3; >20 mitotic cells scored per experiment). Error bars indicate mean ± SD. Bars, 10 µm.

