Figure 5.
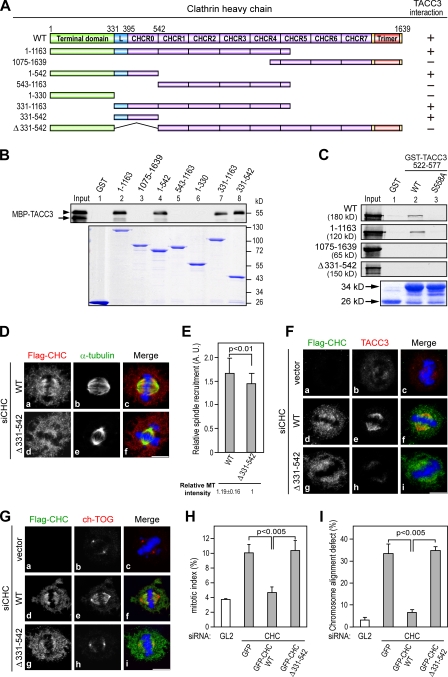
The CHC 331–542 region is important for TACC3 interaction and spindle recruitment. (A) A schematic presentation of the CHC domains and deletion mutants used in this study is shown. The interaction of each CHC deletion mutant with TACC3 is indicated. (B) Western blotting shows MBP-TACC3 522–577 recombinant proteins phosphorylated by aurora A and pulled down by the indicated GST fusion proteins. Input represents the 5% amount of MBP-TACC3 protein phosphorylated by aurora A used for each binding reaction and detected by anti-MBP antibody. The arrowhead and arrow indicate phosphorylated and unphosphorylated MBP-TACC3 522–577, respectively. Coomassie blue staining shows the GST fusion proteins used for each binding reaction. (C) Autoradiograph of in vitro 35S-labeled CHC WT or truncated proteins pulled down by GST-TACC3 522–577 proteins being phosphorylated by aurora A. Input and Coomassie blue staining represent 10% of the amount of in vitro–synthesized proteins and GST fusion proteins used for each binding reaction, respectively. (D) Images of HeLa cells treated with siCHC for 6 h and transfected with siCHC-resistant Flag-CHC WT or mutant for an additional 66 h and stained with DNA (blue), α-tubulin (green), and Flag-CHC (red). (E) Histogram shows the relative spindle recruitment of CHC WT or Δ(331–542) in siCHC-treated cells observed in D. The relative spindle MT intensity was normalized against the MT intensity obtained from siCHC and Δ(331–542)-transfected cells (>25 mitotic cells scored per construct). (F and G) Images of HeLa cells transfected with siCHC and the indicated siCHC-resistant Flag-CHC constructs as described in D were stained for Flag-CHC (green), TACC3 (H-300), or ch-TOG (red) and DNA (blue). (H and I) Bar graphs show mitotic index (H) or misaligned chromosomes (I) of HeLa cells transfected with the indicated siRNAs along with siCHC-resistant GFP-CHC constructs (n = 3; mitotic index, >500 cells scored; chromosome alignment defect, ∼100 cells scored). Error bars indicate mean ± SD. Bars, 10 µm.

