
Figure 7.
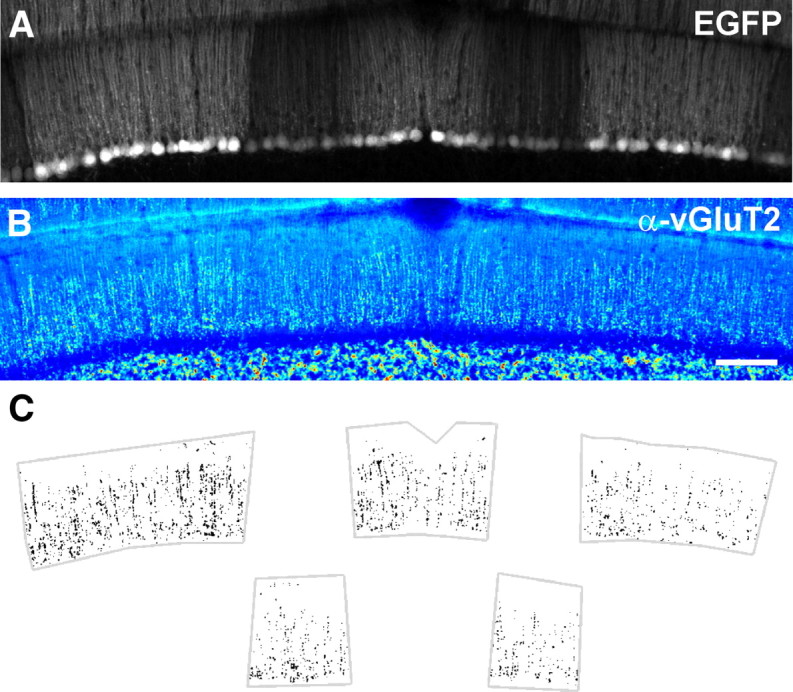
CFs in Z+ zones exhibit higher vGluT2 immunoreactivity. A, Native EGFP fluorescence in a coronal section of cerebellum from an EAAT4-EGFP mouse containing Z+ and Z− zones. B, vGluT2 immunoreactivity for the region shown in A, pseudocolored with warmer colors indicating higher pixel intensities. Scale bar, 100 μm. C, Plot of all pixels in Z+ (top) and Z− (bottom) zones from the section shown in A that exceeded a threshold set at 95% of pixel intensities measured within Z+ zones.