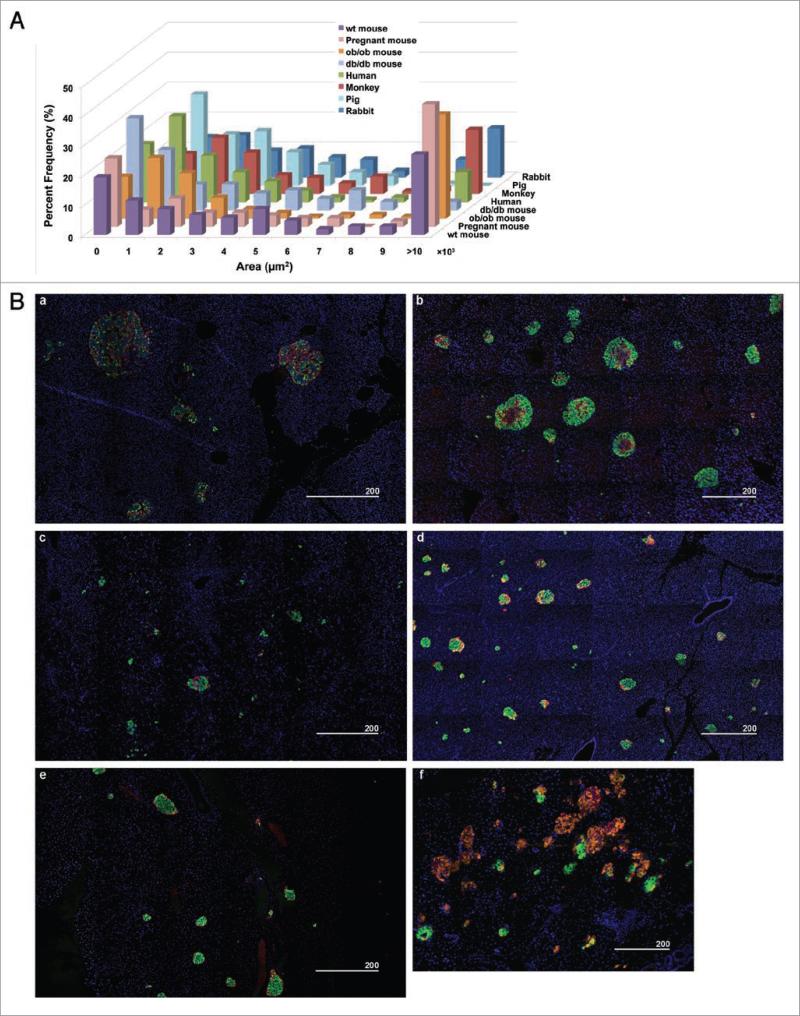
Figure 1.
Immunohistochemical analysis of pancreatic islets from various species. (A) Islet size distribution across several species including ob/ob, db/db and pregnant mice. Note the similar distribution pattern within the closely overlapping range in size among species. (B) Immunofluorescent staining of insulin (green), glucagon (red), somatostatin (orange) and nuclei (blue) showing an overview of islet distribution in each species. (a) Human, (b) Rhesus monkey, (c) Pig, (d) Rabbit, (e) Mouse, (f) Song bird. Scale in μm.

