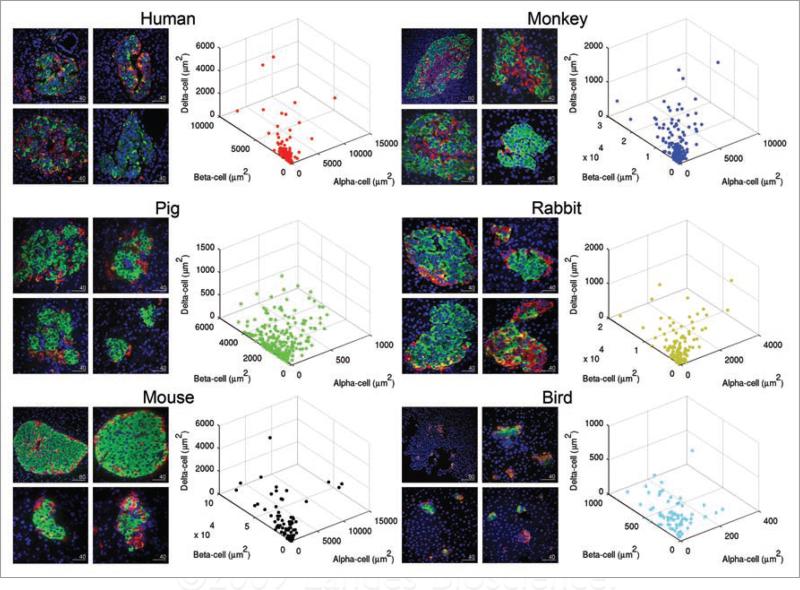
Figure 2.
Plasticity and variability of islet in various species. Representative islets of each species are shown on the left, and distribution of islets according to endocrine cell composition is plotted in 3D on the right. Each dot depicts a single islet. Note the diversity of islet size, shape and cell composition among species as well as within the same species, demonstrating the plasticity and variability of islets. For birds, islets with beta-cells were selectively shown. Scale in μm.

