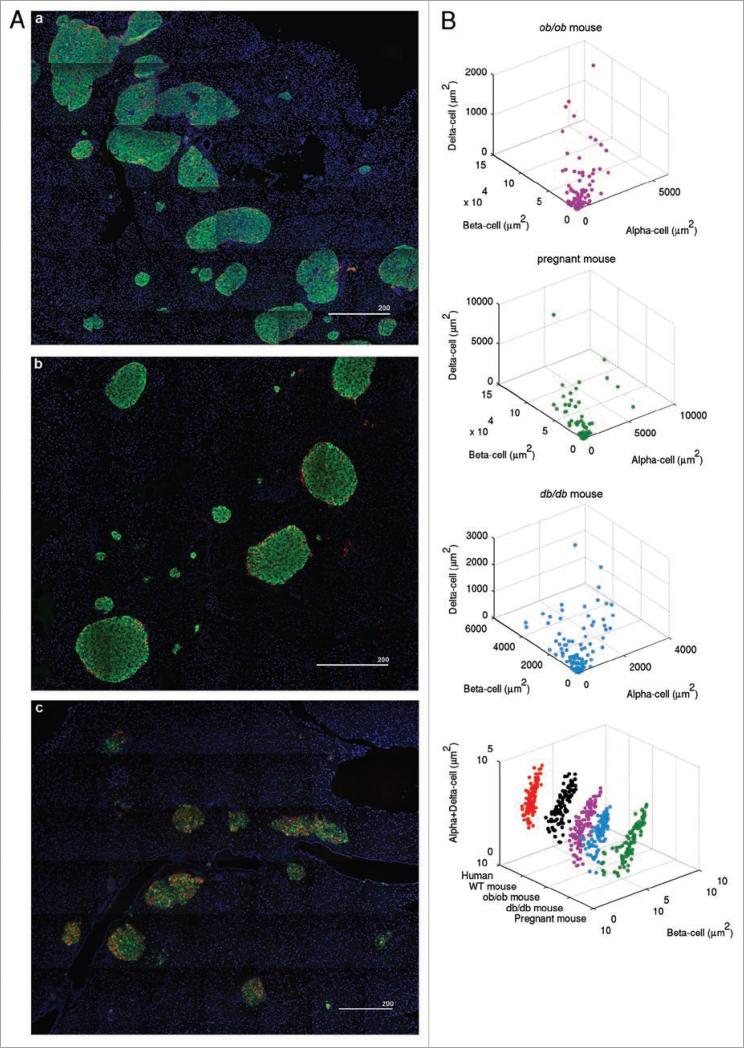
Figure 4.
Changes in islet architecture and composition under pathophysiological conditions such as obesity, pregnancy and diabetes. (A) Overviews of islet distribution in ob/ob (a), pregnant (b) and db/db (c) mice. Scale in μm. (B) Corresponding 3D scatter plots to images in (A) are shown. Distribution of endocrine cell composition is compared between human and mice under normal and pathophysiological conditions (lower left). Note the similarities in islet size distribution and islet composition between humans and mice.

