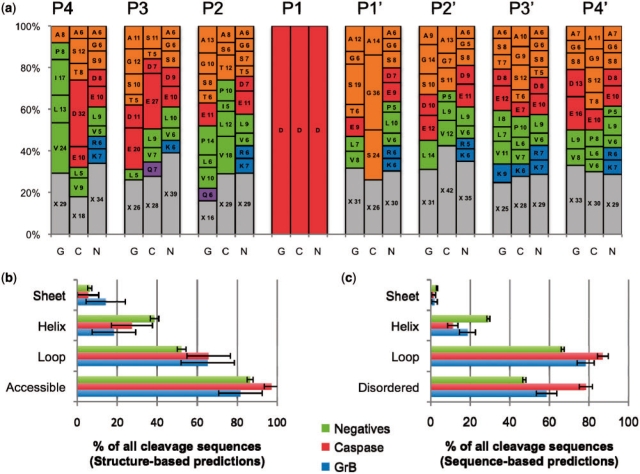
Fig. 2.
Sequence and structural properties of cleavage sequences. (a) A stacked histogram showing the relative frequency of each residue type at each position in the cleavage sequence for substrates of GrB (G) and caspases (C), and negatives (N). The numbering spans positions from P4 to P4′. Letters on the plots represent the one-letter code for each amino acid residue type, followed by its percentage at that position. X (gray) represents the total percentage for all residue types that are present in the position at <5% relative frequency. Amino acid residue types are grouped by general characteristic (Green: hydrophobic; orange: small non-polar; red: charged acidic; blue: basic; purple: polar). (b) Structural properties of protease cleavage sequence positives and negatives as assessed by DSSP for substrates where a solved structure or good quality comparative model was available. Numbers may not add to 100% as some peptides did not have more than four residues in any one of the three secondary structure conformations. (c) Structural properties as assessed by predictive methods that consider the protein primary sequence only. Disopred predicted disorder in all substrates. PSI-PRED predicted secondary structure, in cases where a structure or model of the substrate was not available.

