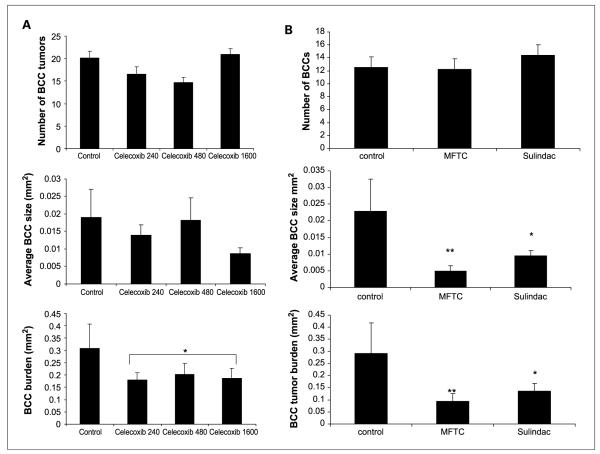
Fig. 3.
A, IR-induced tumor number, average size, and burden at age 9 mo in standardized biopsies in Ptch1+/− mice fed chow (control, n = 19), 240 ppm celecoxib (n = 21), 480 ppm celecoxib (n = 28), or 1,600 ppm celecoxib (n = 23). Columns, mean; bars, SE. Celecoxib-treated mice are compared with control-treated mice. *, P < 0.05. B, IR-induced tumor number, average size, and burden at age 9 mo in standardized biopsies in Ptch1+/− mice fed chow (control, n = 10), MF-tricyclic (MFTC; n = 10), or sulindac (n = 10). Columns, mean; bars, SE. MF-tricyclic–treated and sulindac-treated mice are compared with control-treated mice. *, P < 0.05; **, P < 0.01.

