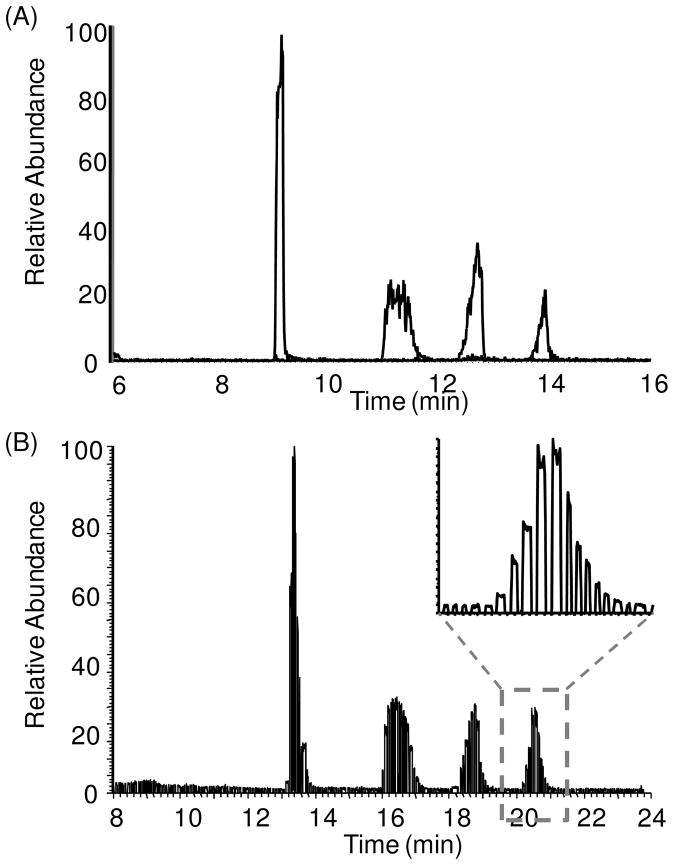
Figure 5.
Overlap of RICs for 4 metabolite components. (A) On-line detection of 4 sample on micromass QQQ MS, showing peaks of malate, citrate, PEP and F1,6P in a row. (B) Raw RICs of the 4 sample in droplet format obtained using the LIT MS. Using the same flow rate at 500 nL/min, it took 16 min to analyze 10 min of LC effluent because the oil in the final segmented flow accounts for 3/8 of total volume. A zoomed look of the detection of fractions over the F1,6P peak was shown.

