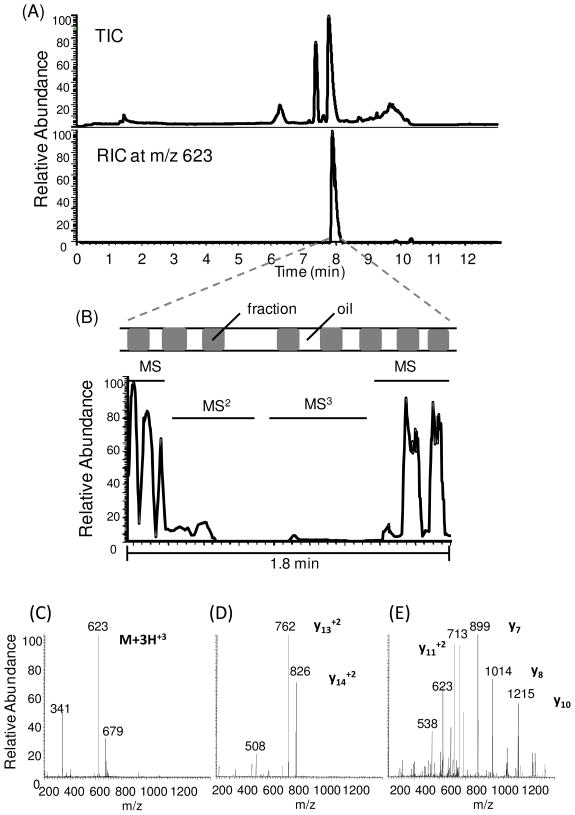
Figure 7.
(A) TIC and RIC of trypsin digested CRF. RIC showed the peak of the most abundant fragment peptide at m/z 623. (B) The expanded region of the TIC corresponding to the peak parking event initiated when first peak at m/z 623 was seen for MS detection of segmented flow of the separation. MS2 and MS3 analyses were performed manually by selecting the most abundant parent ion. Sample droplet distribution was indicated, which was uneven due to unstable perfusion flow rate at 25 nL/min generating by the syringe pump. TIC for MS2 and MS3 were lower compared to MS signal. (C),(D), and (E) show mass spectra corresponding to the MS, MS2 and MS3 event respectively in the peak parking region.

