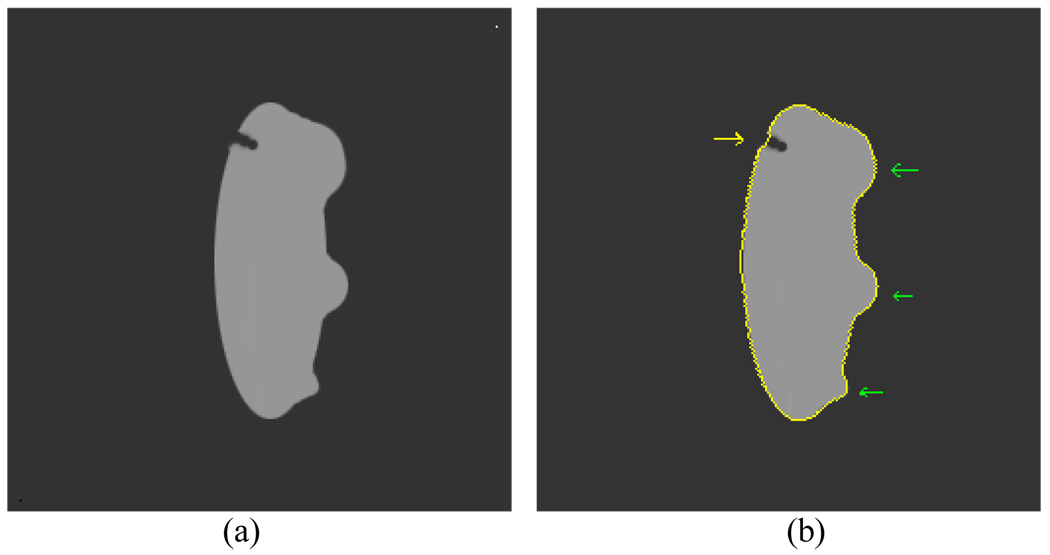
Fig. 11.
An artificial image mimics the bladder wall which shows how the bent rate influences the segmentation result. (a) The original image. (b) The segmentation result. The yellow curve represents the segmentation result. The abnormalities of different sizes on the inner border are pointed by green arrow, while a gap on the outer border is pointed by yellow arrow.

