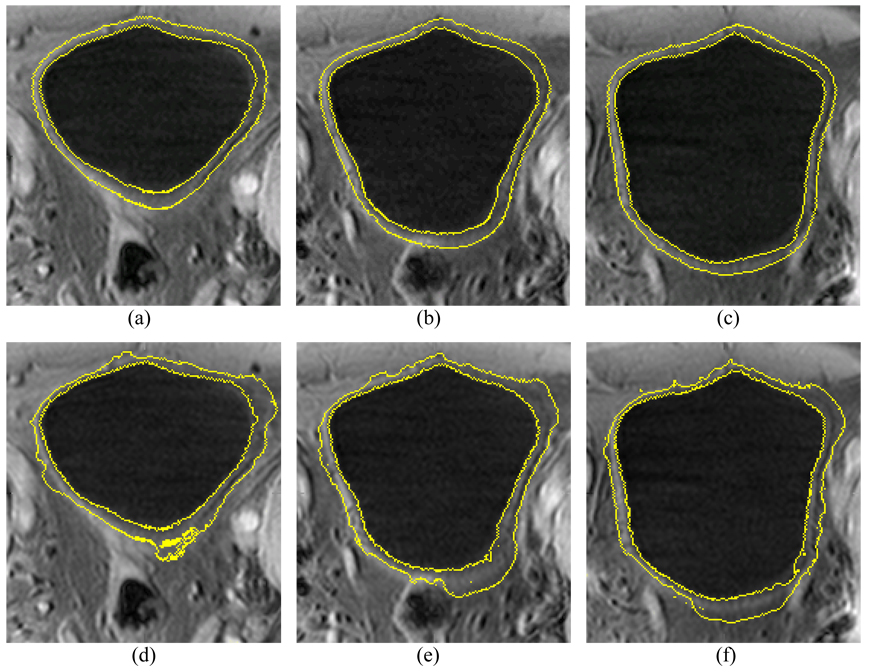
Fig. 12.
An example of segmentation results from the volunteer datasets using the presented method and the C-V model. Top row (a)–(c) shows the segmented results of the presented method. Bottom row (d)–(f) shows the segmented results of the C-V model. The intensity distribution is very complex around the outer border of the bladder wall. Since it considers the local contrast and applies prior geometry constraint, the presented method performs much better than the original C-V mode.

