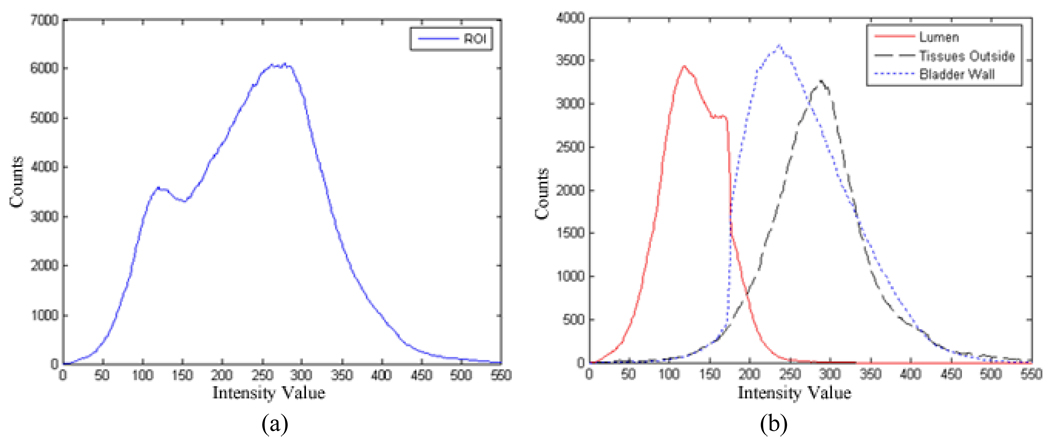
Fig. 14.
Histogram of voxels inside a VOI enclosing the whole bladder of Fig. 12. Picture (a) is the histogram of all voxels inside the VOI. Picture (b) shows the histograms of the segmented voxels inside the VOI as bladder lumen (red), bladder wall (blue), and soft tissues outside the bladder wall (black). The image intensity distributions of the bladder wall and the surrounding soft tissues overlap on a large portion of the histogram.

