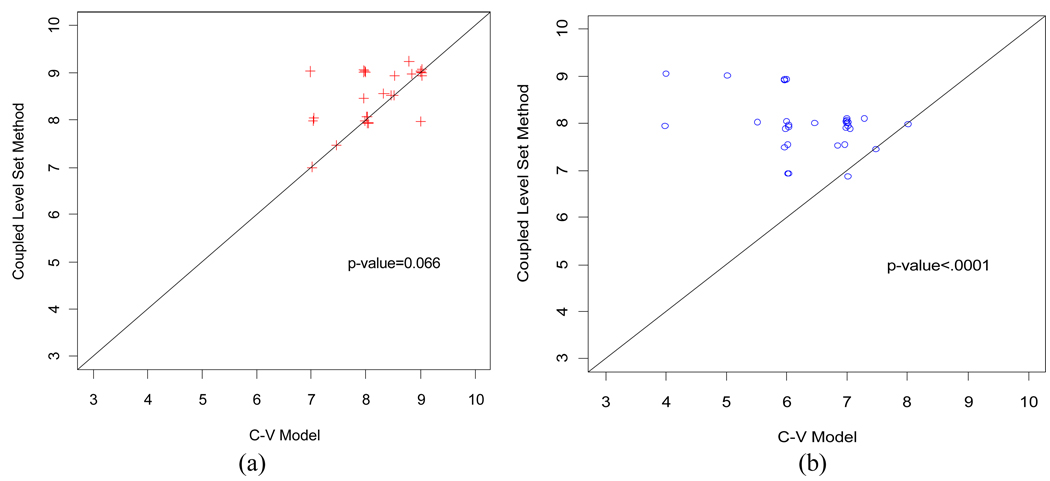
Fig. 15.
Scatter plot of the scores from the coupled-LS method against the C-V model. Picture (a) shows the scatter plot of the scores from the segmented inner border. Picture (b) shows the scatter plot of the scores from the segmented outer border. The coupled-LS method gained significant higher scores than the C-V model, especially for the outer border of the bladder wall.

