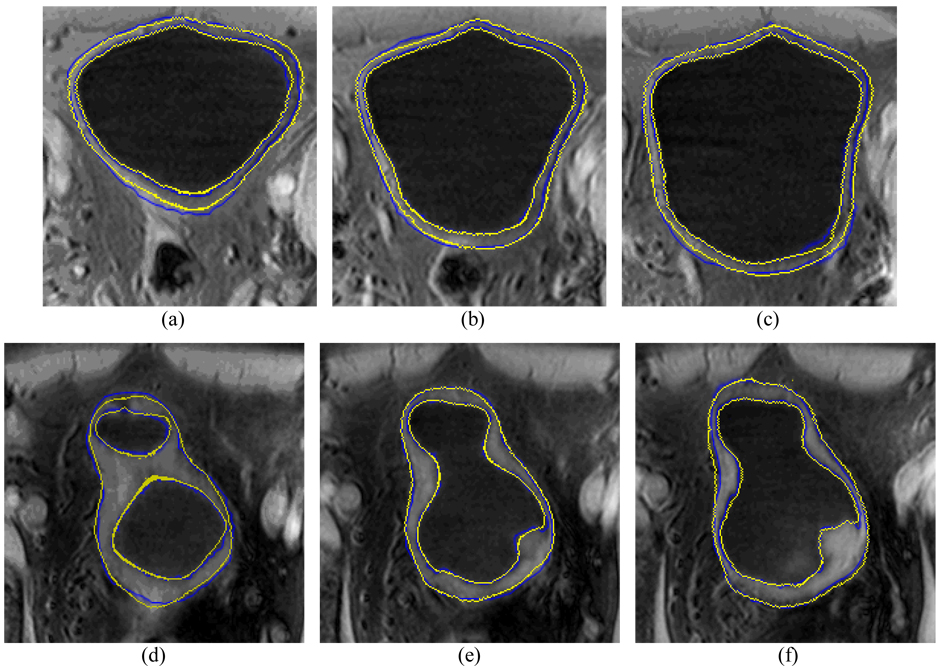
Fig. 16.
Examples of manually-drawn results and computer segmentation results. Top row (a)–(c) shows the results from a volunteer study, where the blue contour represents the manually-drawn result and the yellow contour represents the computer segmentation result of the presented method. The computer segmentations results were also shown in Fig. 12 and Fig. 13. The bottom row (d)–(f) shows the results from a patient study.

