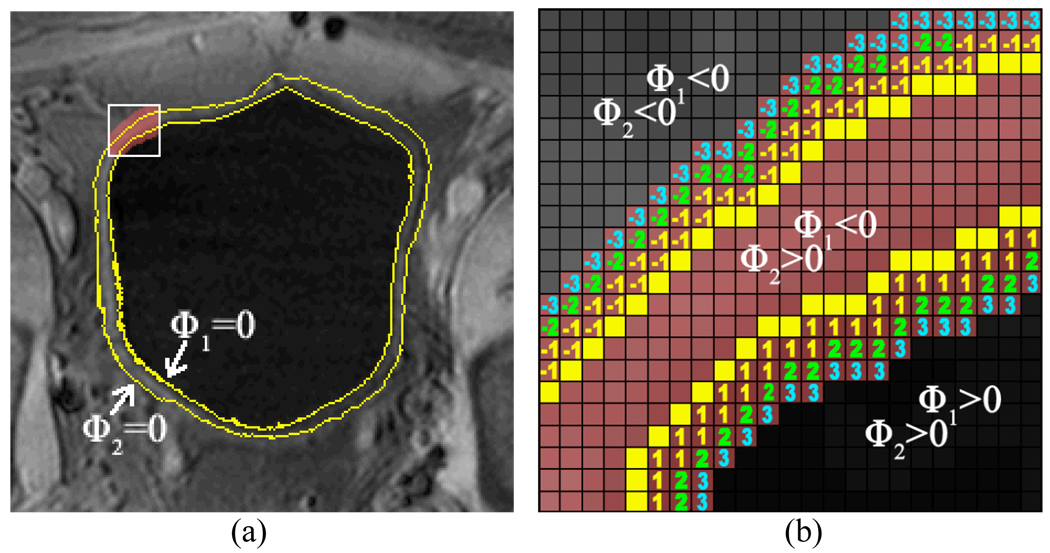
Fig. 6.
An illustration of the ROI. Picture (a) shows the original image with ZLSSs in a slice. The yellow curves are the ZLSSs in this slice. Picture (b) is the enlarged region in the white frame in (a). When d = 3 is chosen as an example, the ROI in the white frame includes those voxels which are colored pink, i.e., the ROI includes (1) the space between the yellow lines and (2) the expanded space labeled −3, −2, −1, 1, 2, and 3.

