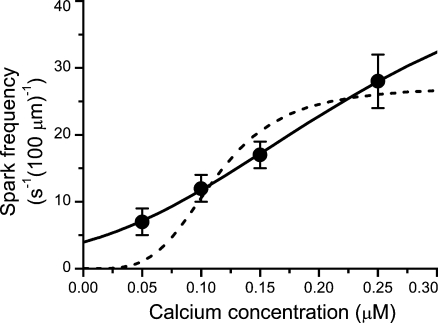
Figure 1.
Approximation of the calcium dependence of spark frequency. Symbols with error bars represent data on permeabilized myocytes from Lukyanenko and Györke (1999). The lines represent the best fits by Eq. 5 with parameters shown in Tables I and II for the aHTG (solid line) and HTG (dashed line) models. Both the experimental and model data were obtained at 1 mM of free Mg2+ in the cytosol. The abscissa shows the cytosolic calcium concentration.

