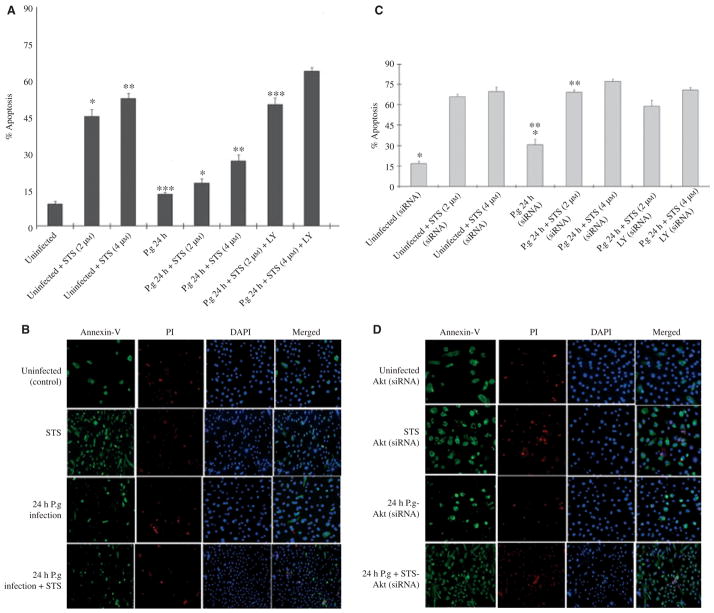
Figure 2.
Quantitative analysis of cell death by Annexin-V and propidium iodide (PI). The percentage of dying cells was determined by dual staining with fluorescein isothiocyanate-conjugated Annexin-V and PI using fluorescence microscopy. The threshold of fluorescence intensity was determined with samples that were uninfected and untreated. Staurosporine (STS) treated cells and ethanol-treated cells (not shown), respectively, were used to evaluate the positively Annexin-V and/or PI-stained cells. At least 10 separate fields containing an average of 50 cells were studied quantitatively from three independent experiments performed in duplicate (A). Primary gingival epithelial cell (GEC) monolayers grown on microscopic chambers were incubated in the binding buffer containing Annexin-V (green fluorescence) and PI (red fluorescence). PI was used for the discrimination of necrotic or late apoptotic cells from the Annexin-V-positively stained cells. The nuclear stain DAPI (blue fluorescence) was used to visualize the number of cells in the field. (B) The simultaneous quantitative analysis and microscopic examinations were employed in the Akt-deficient GECs for similar conditions to those employed with normal GECs (C, D). Asterisks denote statistical significance (*P = 0.006, **P = 0.001, and ***P = 0.01; Student’s t-test) for 24-h uninfected + STS-treated (2 μM) GECs versus 24-h infected + STS-treated (2 μM) GECs, for 24-h uninfected + STS-treated (4 μM) GECs versus 24-h infected + STS-treated (4 μM) GECs, and for 24-h infected GECs versus 24-h infected + STS (2 μM) + LY-treated GECs, respectively (A). Asterisks denote statistical significance (*P = 0.03 and **P = 0.005; Student’s t-test) for 24-h uninfected + siRNA-treated GECs versus 24-h infected + siRNA-treated GECs and 24-h infected + siRNA-treated GECs versus 24-h infected + STS + siRNA-treated GECs, respectively (C).

