
Figure 5. IL-6shRNA delivery decreased IL-6 and TNF-α expression in aorta.
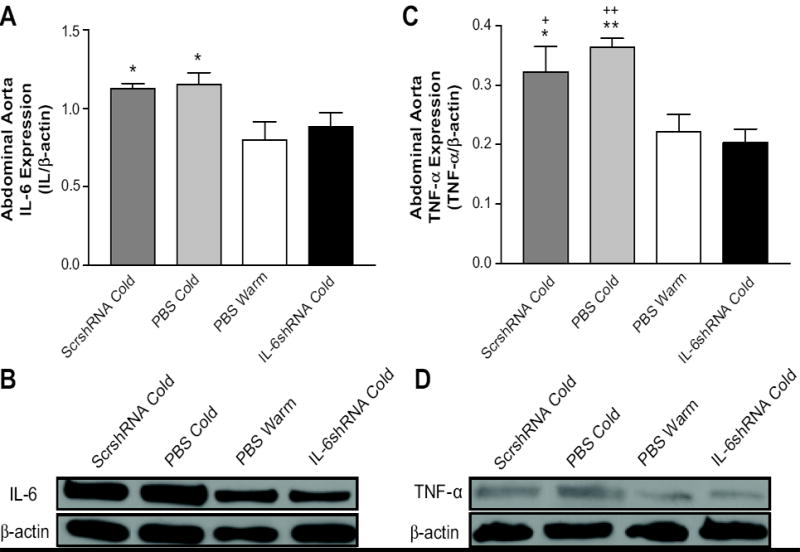
Quantitative analysis of IL-6 protein expression in abdominal aorta (A) and the representative Western blot bands of IL-6 (B). Quantitative analysis of TNF-α protein expression in abdominal aorta (C) and the representative Western blot bands of TNF-α (D). *p<0.05, **p<0.01 vs PBS Warm group; +P<0.05, ++P<0.01 vs the IL-6shRNA Cold group. Data=means+SE. n=6.