
Figure 2.
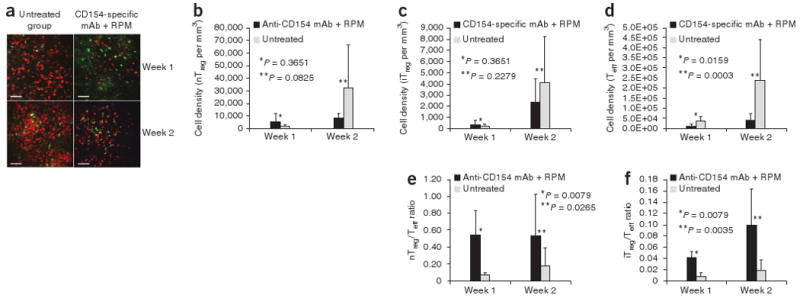
Analysis of infiltrating T cells within islet allografts. (a) Representative intravital microscopy images showing T cell infiltration within islet allografts in untreated hosts and hosts treated with CD154-specific mAb plus rapamycin on week 1 and week 2 after transplantation. Scale bar, 100 μm. (b–d) Summary of cell density of islet allograft–infiltrating nTreg (b), iTreg (c) and Teff (d) cells, as detected by intravital imaging. (e,f) Summary of the ratios of islet allograft–infiltrating nTreg to Teff (e) and iTreg to Teff (f) cells, as detected by intravital imaging. Error bars represent means ± s.d.