
Figure 4.
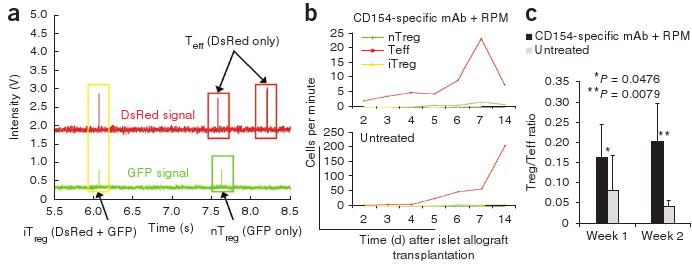
Detection of nTreg, Teff and iTreg cells by in vivo flow cytometry in the peripheral blood. (a) A representative in vivo flow cytometry trace showing the identification of single positive nTreg (green box), Teff (red boxes) and double-positive iTreg (yellow box) cells. The second peak in the DsRed channel occurred about 45 ms before the second peak in the GFP channel. As this time difference was greater than the uncertainty of the measurements, these two peaks were distinguished as separate cells and not a double-positive iTreg cell. (b) In vivo flow cytometry showing Teff (red), nTreg (green) and iTreg cells (yellow) in the peripheral blood. There is a ten-fold difference in scale between mice treated with CD154-specific mAb plus rapamycin and untreated mice. Each curve represents serial analysis of the same blood vessel of the same animal. (c) Summary of the ratio of circulating Treg to Teff cells, as detected by in vivo flow cytometry. Error bars represent means ± s.d.