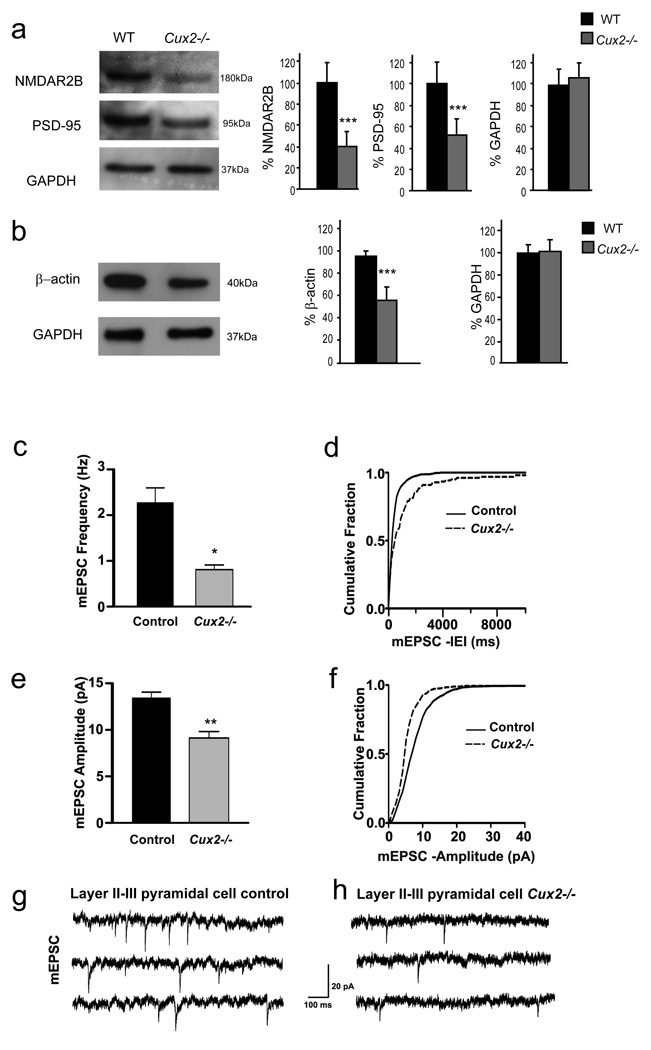
Figure 5. Reduced expression of synaptic proteins and changes in layer II–III mEPSC in amplitude and frequency in Cux2−/−.
a, b) Reduced expression of synaptic proteins in Cux2−/−.Western blot analysis of the expression of NMDAR2B, PSD-95 (a) and β-actin (b) in total cortical lysates from WT (n=4) and Cux2−/− (n=4). Graphs show the mean and SD signal quantification of the relative amount of protein in WT and Cux2−/− cortices. *** p<0.001. c) Average frequency of mEPSC of layer II–III pyramidal cells from control (WT and Cux2+/−) and Cux2−/− mice. (* p< 0.0005, Student’s, unpaired t test, n=13 and 14 cells, respectively), d) Cumulative fraction curves of interevent intervals (IEIs) for mEPSC of layer II–III pyramidal cells showing longer IEIs in Cux2−/− compared with control (p < 0.0005, K–S test). e) Average amplitude of mEPSC in layer II–III pyramidal cells from Cux2−/− (** p < 0.0005, Student’s, unpaired t test, n=13 and 14 cells, respectively). f) Cumulative fraction curves of amplitude of layer II–III pyramidal cells showing smaller amplitude in Cux2−/− animals compared with control (p < 0.0005, K-S test). g, h) Representative traces of mEPSC from layer II–III pyramidal cells of control and Cux2−/− mice, respectively. Data in bar graphs depict mean + SEM; control: black bars; Cux2−/−: gray bars. IEI: Interevent interval. mEPSC: miniature excitatory postsynaptic current.

