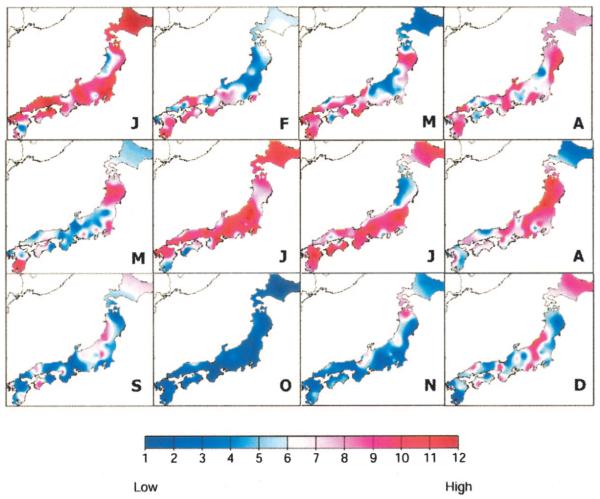
FIGURE 3.
Monthly Kawasaki syndrome activity, 1987–2000. The mean hospitalizations per month were calculated for each prefecture during the 14-year period and ranked on a 1–12 scale (see color bar), with red and blue representing the highest and lowest means for each prefecture, respectively. Months of the year are designated by single letter. Note the peaks in January and June/July with a nadir in October. Because of the continuous color algorithm, the color variations do not precisely correspond to prefecture boundaries.

