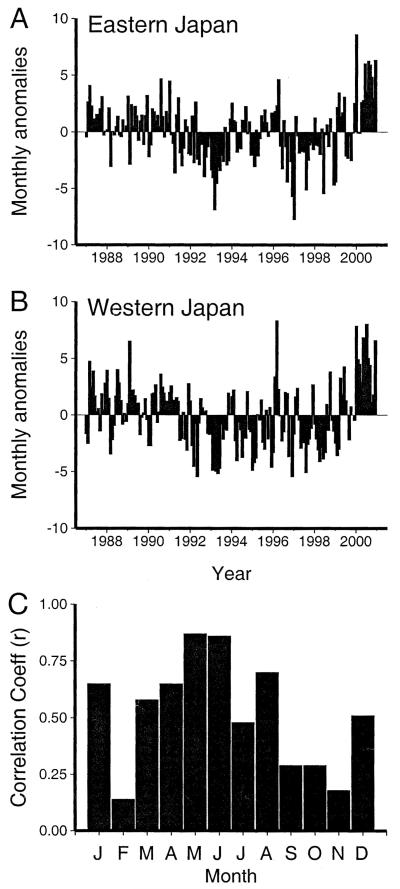
FIGURE 4.
Monthly anomalies, 1987–2000. Average number of Kawasaki syndrome hospitalizations per day expressed as a deviation from the mean number of hospitalizations per day for (A) eastern Japan and (B) western Japan after linear regression analysis to eliminate the effect of increasing incidence during the 14-year period. C, Correlation coefficient for detrended monthly anomalies for eastern versus western Japan.

