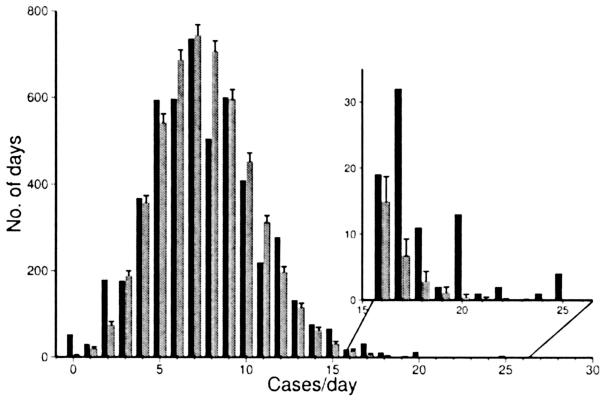
FIGURE 5.
Comparison of the observed distribution of daily Kawasaki syndrome incidence (black bars) with the simulated distribution of the same number of synthetic cases created by a random number generator and repeated 10,000 times (Monte Carlo distribution, gray bars) for eastern Japan, January-December. Data are for 1987–2000 (5114 days). The inset shows a detail of the number of days on which there were 16–26 cases per day.

