Figure 4.
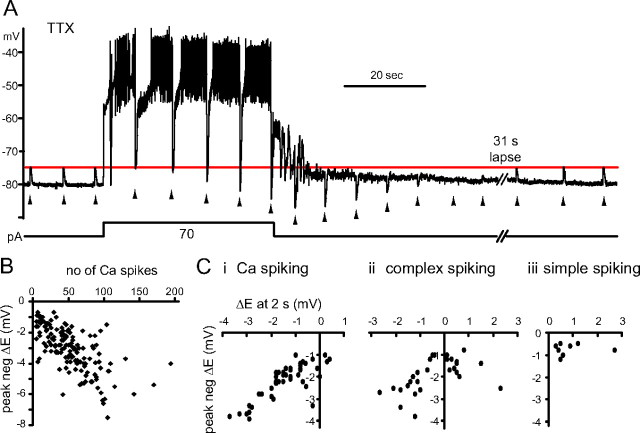
Ca2+ spiking leads to Egly shifts. A, Glycine responses (2 mm, marked by arrowheads) shifted negative during a prolonged period of Ca2+ spiking. Spikes were evoked for 42 s by +70 pA from −30 pA bias. A negative shift and recovery in Egly was evident as the polarity of glycine responses changed from depolarizing to hyperpolarizing after Ca2+ spiking and back to depolarizing. The hyperpolarization to −80 mV at 2 s into the stimulus was an afterhyperpolarization of the first Ca2+ spike, and the fluctuation of Vm during 10 s after Ca2+ spiking is thought to be a manifestation of the intrinsic bistability of CWCs. B, Plot of the peak negative (neg) shift in Egly versus the number of high-threshold Ca2+ spikes evoked during an 8 s challenge protocol. Dots represent 148 Egly series from 83 CWCs. 104 series are from 55 cells recorded with AM dye solution and 44 series from 28 cells without dye. C, The shifts in Egly at 2 s after an 8 s Ca2+ spiking (i), complex spiking (ii), or simple spiking (iii) are plotted against the peak negative shift of the Egly series. Dots in each plot represent single Egly series from different cells, with n = 44, 29, and 8 for i, ii, and iii, respectively. All data were obtained in TTX except for that shown in Cii, iii.

