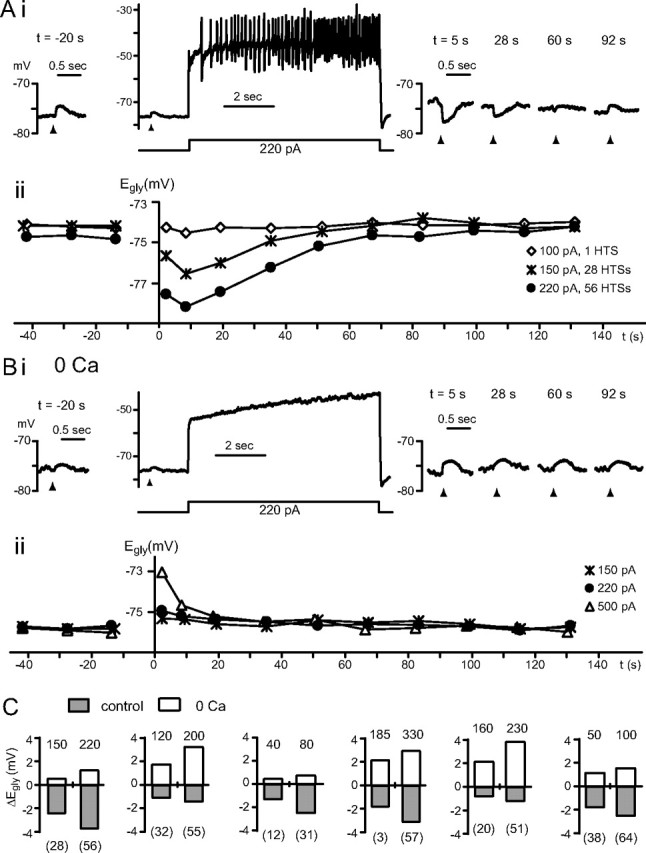
Figure 5.

Ca2+-dependent and -independent change in Egly. A, B, Data from one cell comparing glycine responses and Egly measurements in control condition (A) with those in zero-Ca2+ (B). Time 0 is the moment the 8 s depolarizing current injection terminated. Ai, After 56 high-threshold Ca2+ spikes induced with a 220 pA injection, the glycine response shifted negative. Aii, The Egly series measured along with the Vm recording in Ai is shown (●) with two other series obtained with different amounts of current injections. The negative Egly shifts peaked at 8.5 s. HTSs, High-threshold spikes. Bi, ii, The Vm and Egly series in zero-Ca2+ (replaced with Mg2+) are displayed in the same way as in A. After a depolarization in zero-Ca2+, no negative shift but a positive shift in Egly occurred. Bias current was −40 pA in Ai and −55 pA in Bi. C, Bar graphs showing the peak change in Egly after an 8 s current injection (amount in pA indicated above each bar) in control condition and in zero-Ca2+ from six cells. The number of Ca2+ spikes evoked is shown in parentheses under each bar belonging to control conditions. All data were obtained in TTX.
