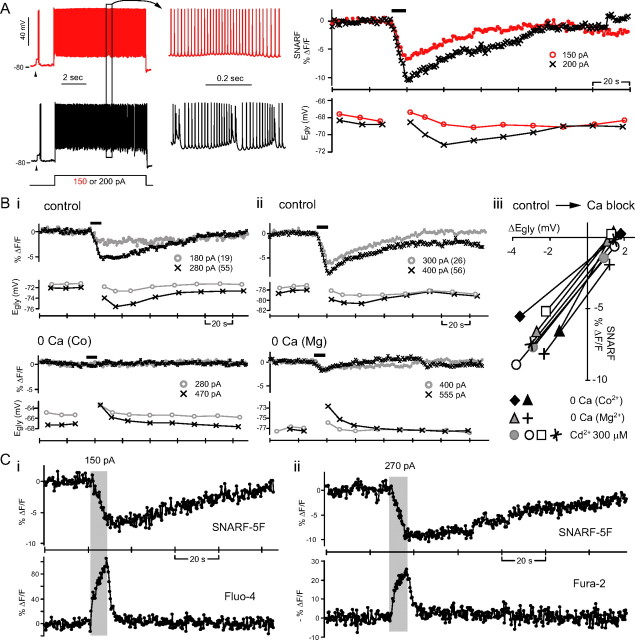
Figure 6.
Ca2+-dependent intracellular acidification. A, Simultaneous monitoring of pHi and Egly with respect to 8 s of simple spiking (red) and complex spiking (black) in one cell. Arrowheads indicate glycine (2 mm) responses. The pH-sensitive dye SNARF-5F's signal is the average fluorescence intensity of a region of interest drawn inside the cell body. An intracellular acidification, manifested as a decrease in SNARF's signal, occurred during both simple spiking and complex spiking. The black bar above SNARF traces indicates the duration of 8 s depolarizing current injection. B, The intracellular acidification was also seen with Ca2+ spiking (in TTX) and inhibited by zero-Ca2+ (replaced with Co2+ or Mg2+) or 300 μm Cd2+. Bi–ii, Simultaneously recorded SNARF signal and Egly from two cells. The 8 s depolarizing current injections evoking Ca2+ spikes or just depolarization after Ca2+ channel block are marked with thick bars above SNARF traces. The amount of injected current is shown beside each symbol along with the number of evoked Ca2+ spikes in parenthesis. An example of complete block (Bi) and incomplete block (Bii) of the depolarization-induced acidification by zero-Ca2+ is shown. Biii, Relation between the change in SNARF signal to the peak negative Egly shift in control condition and the peak positive Egly shift in Ca2+ block condition for eight cells. C, The changes in pHi and [Ca2+]i induced by 8 s complex spiking were detected by simultaneous two-photon imaging of SNARF-5F and Fluo-4 or Fura-2. Examples from two different cells are shown. The duration of 8 s depolarizing current injection evoking complex spikes is indicated by the shaded rectangle. The excitation wavelengths were 800 nm (Ci) and 780 nm (Cii).

