Figure 8.
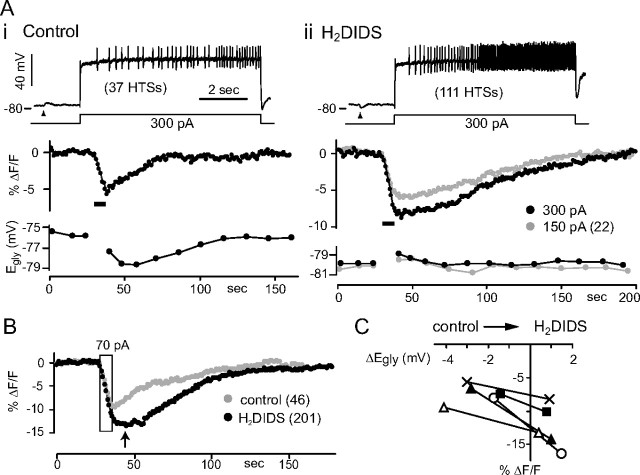
Block of the negative Egly shift by H2DIDS. A, Simultaneously obtained SNARF signal and Egly from one cell are shown for control condition (Ai) and in100 μm H2DIDS (Aii) along with the Vm trace of Ca2+ spiking. Thick bars indicate periods of 8 s Ca2+ spiking. Arrowheads indicate the time of 2 mm glycine puff. The number of evoked Ca2+ spikes is shown in parenthesis. The bias currents during the 8 s current injection were −80 pA and −55 pA for i and ii, respectively. B, Another example showing the difference in magnitude and time course of pHi change between the control condition and in H2DIDS. The period of 8 s Ca2+ spiking evoked with 70 pA is bound by a rectangle. Numbers of evoked Ca2+ spikes are shown in parenthesis. The arrow indicates the time of peak acidification in H2DIDS. C, Plot of peak acidification (in SNARF's ΔF/F) against the peak negative Egly shift in control condition and the peak positive Egly shift in H2DIDS. Five cases (pairs) from different cells are shown. The same depolarizing current injection was used for control and H2DIDS conditions in each of the five cases, but the amount ranged from 70 to 300 pA in different cells. The average of peak negative Egly shifts in controls is −2.6 ± 1.1 mV, and that of peak positive shifts in H2DIDS is 0.9 ± 0.4 mV for the five cases in the plot.

