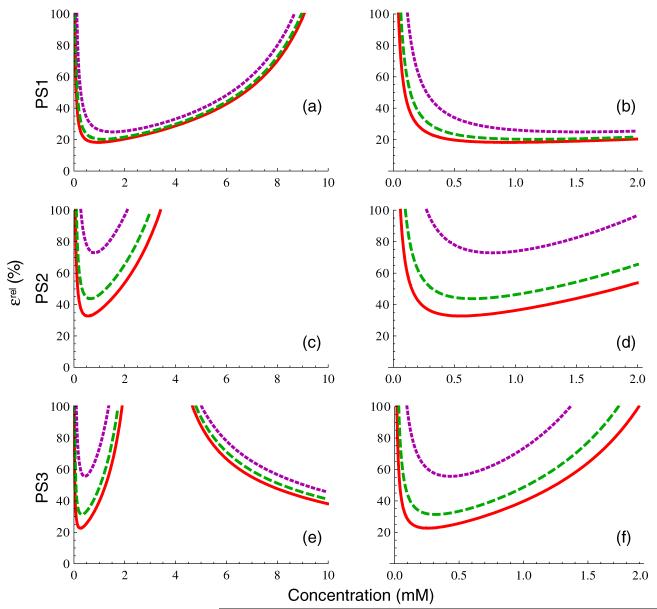
Figure 4.
Relative concentration measurement uncertainty from equation (16b), for PS1 (panels (a), (b)), PS2 (panels (c), (d)), and PS3 (panels (e), (f)) for the three tissue types in figure 2, assuming SNR and NB as given in table 1. The panels in the first column are plotted over the approximate concentration range of clinical interest, while those in the second column are plotted over a smaller range representative of concentrations seen in tissues in vivo.

