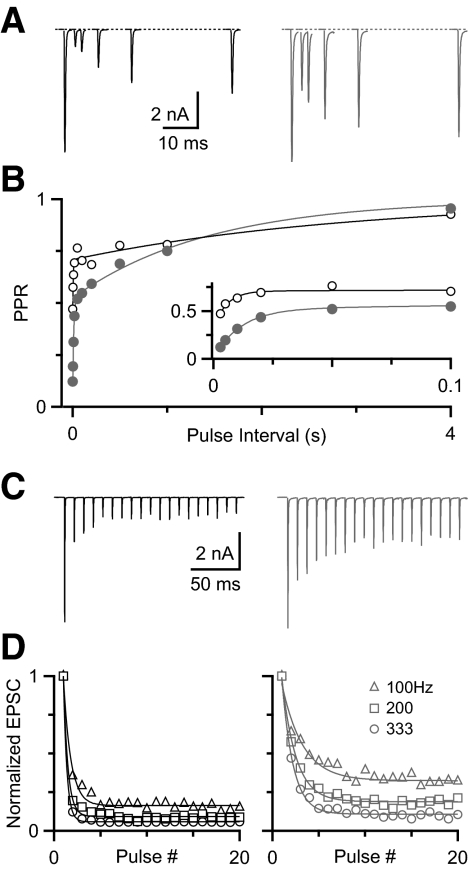
FIG. 2.
Variability of depression at the mouse endbulb of Held. A: example voltage-clamp recordings showing high (left) and low (right) depression in response to pairs of pulses of different intervals. B: the paired-pulse ratio (PPR) recovers according to a double-exponential function (see results for equation and parameters). Inset: magnified view of the fast component. C: excitatory postsynaptic currents (EPSCs) in response to 20 stimuli at 100 Hz. D: high (left) and low (right) depression during trains, normalized to the first peak for 100, 200, and 333 Hz. Data (open markers) were fitted (solid line) with a single-exponential function (see results for equation and parameters).

