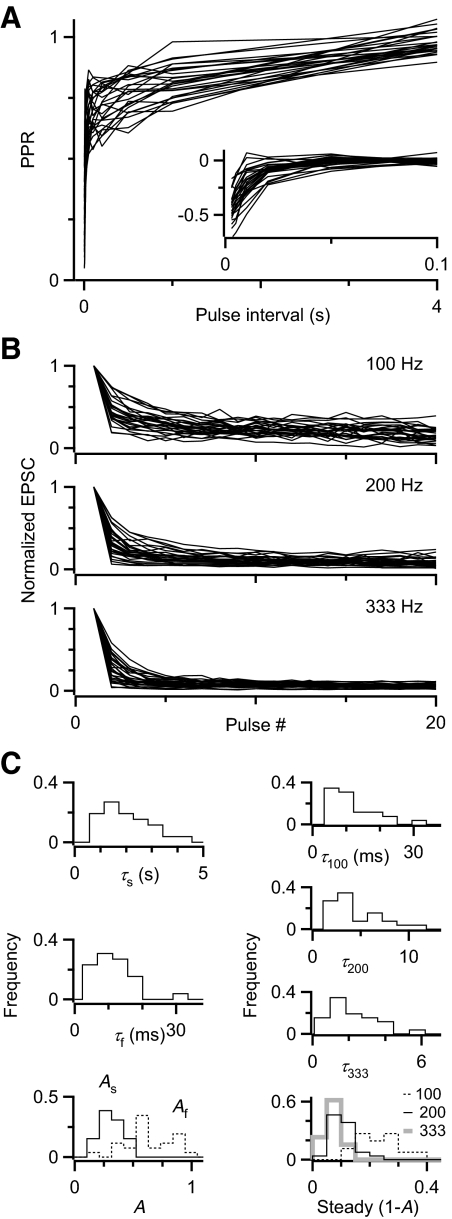
FIG. 3.
Summary of depression parameters. A: PPR recovery curves for 26 cells, highlighting differences in the slow component. Inset: slow component subtracted from each cell to reveal differences in the fast component. B: depression during trains at different frequencies. C: distribution of parameters for fits to paired-pulse and trains data in A and B.

