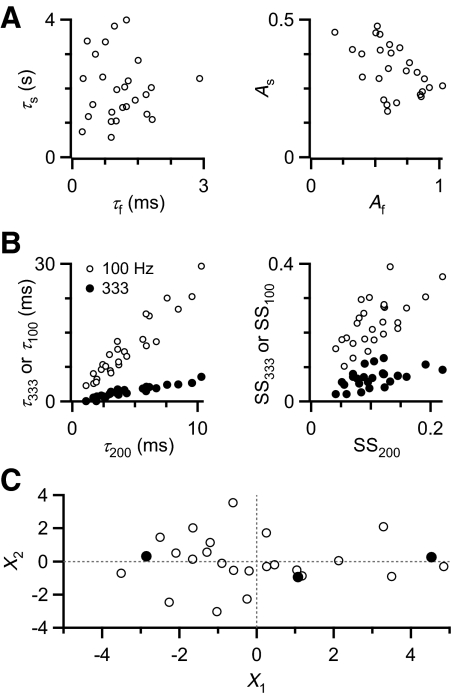
FIG. 4.
Depression parameters transformed by principal components analysis (PCA). A: correlations between parameters from PPR recovery curves. The time constants (left) are poorly correlated (0.02), but the amplitudes are highly correlated (−0.51). B: correlations between train parameters. Correlation coefficients between decay time constants are >0.9 (left) and between steady-state amplitudes are >0.5 (right). C: PCA. Shown are the results for the first 2 PCs, which capture 70% of the original variance. Each open circle represents the transformed data from one cell. Filled circles indicate 3 cells that differ mainly in the first PC and were selected to represent different extents of depression.

