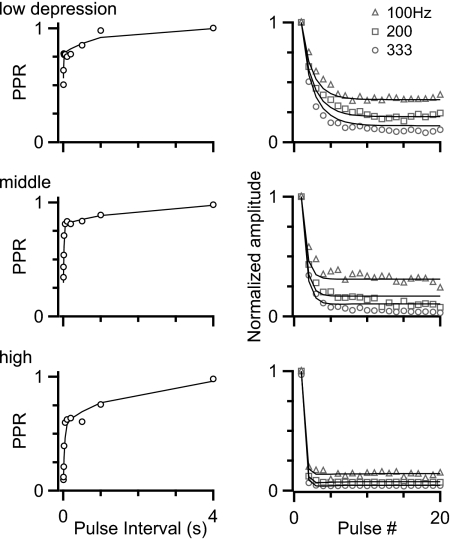
FIG. 5.
Three cells with different levels of depression, selected based on PCA (Fig. 4C). Markers represent data from paired-pulse (left) and train (right) stimulation; lines represent fits to the data using a simplified model of synaptic plasticity.

