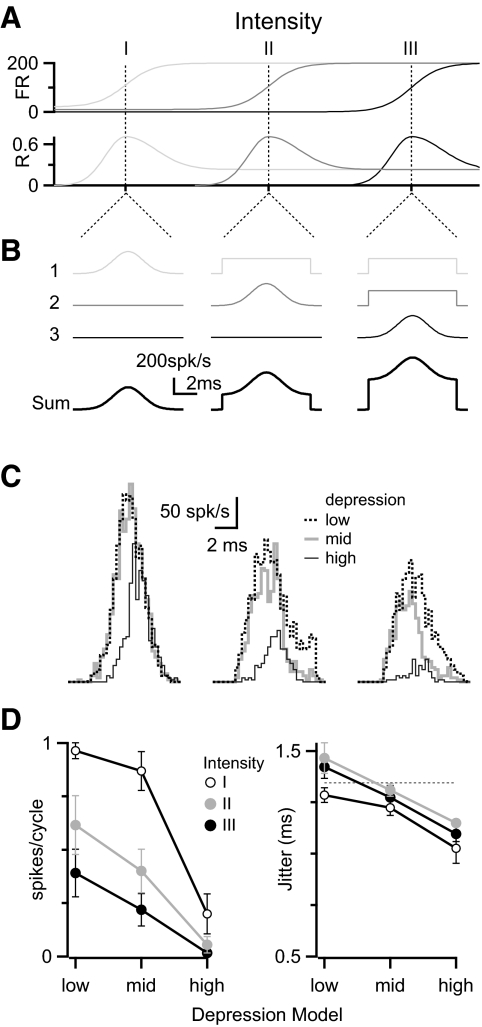
FIG. 9.
The influence of depression on BC responses to multiple inputs with different response properties. A and B: stimulus paradigm, illustrating the response properties (firing rate and phase-locking) for 3 different synaptic inputs to sounds of increasing intensity (A) and their cycle histograms (B). When an input is in its dynamic range, its cycle histogram is a Gaussian of SD = 1.3 ms (equivalent to R = 0.7). C: BC responses in a representative experiment showing how depression affects the response at each sound intensity. D: average results for response probability (left) and jitter (right) over 5 experiments similar to that in C.

