Fig. 4.
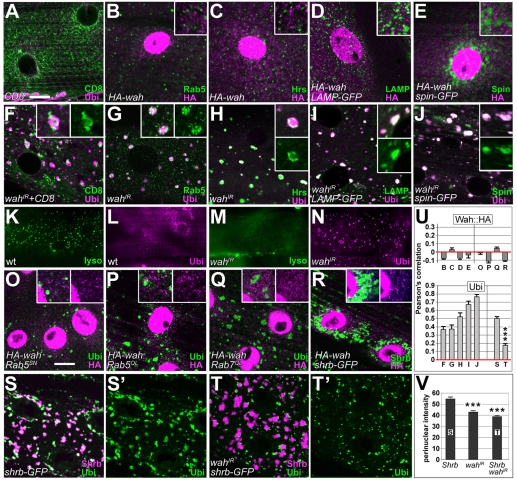
Refining insights into endosomal functions of Wah. All images show horizontal views of late-larval muscles at the level of the sarcoplasm; genotypes or expressed constructs are indicated bottom left, detected labels bottom right. (A-J) Localisation of the membrane marker mCD8-GFP (CD8) and the endosomal and/or lysosomal markers Rab5, Hrs, LAMP-GFP (LAMP) and Spinster-GFP (Spin) in control animals (A-E), and upon knockdown of Wah (F-J); none of the endosomal markers colocalised with HA-Wah (B-E); upon knockdown of Wah, CD8-GFP and endosomal markers accumulate and closely correlate with ubiquitin puncta (F-J). (K-N) Puncta of LysoTracker staining detected by live imaging of wild-type muscles (lyso; K) is abolished upon wahIR expression (M); L and N show specimens from the same batch subsequently stained for ubiquitin. (O-R) Targeted expression of constructs functionally interfering with endosomal trafficking: dominant-negative and activated Rab5 (Rab5SN and Rab5QL, respectively), activated Rab7 (Rab7QL), and dominant-negative snf7 (shrb-GFP); these conditions cause accumulations of ubiquitin (O,P,Q,S), but do not affect the localisation of cytoplasmic HA-Wah puncta (O-R). (S,T) Shrb-GFP co-clusters with ubiquitin around nuclei (S,S′); coexpression of wahIR suppresses perinuclear build-up of ubiquitin (T,T′; see also V) and its localisation to the Shrb-GFP compartment (see also U). (U) Pearson's colocalisation correlation coefficients (1=perfect colocalisation, 0=random distribution, −1=perfect exclusion) for all double-stained images of this plate, as indicated by letters below bars; HA-Wah fails to colocalise with endosomal markers (upper graph, left) and with ubiquitin accumulations induced by endosomal manipulations (upper graph, right); ubiquitin puncta induced by wahIR (lower graph, left) or Shrb-GFP (lower graph, right) colocalise with endosomal markers. ***P≤0.001, Mann-Whitney Rank Sum Test. (V) Pixel intensities of ubiquitin staining measured in circular ROIs of 35-μm diameter concentrically around nuclei; bars represent the means of respective histograms. ***P≤0.001, Mann-Whitney Rank Sum Test. Scale bar (in A): 30 μm (for K-N); 15 μm (for all other images; insets are 200% enlarged).

