Fig. 2.
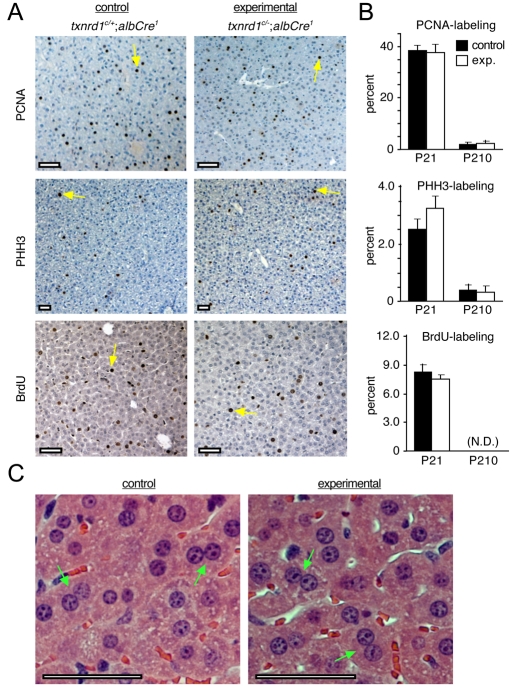
Developmental proliferation of Txnrd1-deficient hepatocytes. (A) Mice of genotypes Txnrd1cond/+;AlbCre1 (left panels, controls) or Txnrd1cond/−;AlbCre1 (right panels, experimentals) were killed at P21 and liver sections were immunostained for PCNA (upper panels; marker of proliferative cells), for PHH3 (middle panels; M phase marker), or for BrdU inorporation (lower panels; S phase marker). Yellow arrows indicate representative hepatocytes that stained for PCNA (upper panels), PHH3 (middle panels), or BrdU (lower panels). (B) Proliferative indexes during liver development. The percentage of hepatocytes labeled for each proliferative marker in P21 livers were quantified; non-hepatocyte cells were excluded from the counts. Values are means and s.e.m. of at least three animals under each condition, as described in Materials and Methods. N.D., not determined. Statistical analysis indicated that none of the differences between control and experimental samples was significant (P>0.05). (C) Histology of control and experimental livers. Green arrows denote representative bi-nucleate hepatocytes. Scale bars: 100 μm in all panels.

